Assessment,of,physicochemical,properties,of,water,and,their,seasonal,variation,in,an,urban,river,in,Bangladesh
时间:2023-06-20 18:25:10 来源:柠檬阅读网 本文已影响 人 
Arft Rhmn ,Ishrt Jhnr ,Yesmin Nhr Jolly
a Department of Soil,Water and Environment,University of Dhaka,Dhaka 1000,Bangladesh
b Atmospheric and Environmental Chemistry Laboratory,Chemistry Division,Atomic Energy Centre,Dhaka 1000,Bangladesh
Abstract To assess the magnitude of water quality decline in the Turag River of Bangladesh,this study examined the seasonal variation of physicochemical parameters of water,identified potential pollution sources,and clustered the monitoring months with similar characteristics.Water samples were collected in four distinct seasons to evaluate temperature,pH,dissolved oxygen(DO)concentration,five-day biochemical oxygen demand(BOD5),chemical oxygen demand(COD),electrical conductivity(EC),chloride ion(Cl-)concentration,total alkalinity(TA),turbidity,total dissolved solids(TDS)concentration,total suspended solids(TSS)concentration,and total hardness(TH)using standard methods.The analytical results revealed that 40%of water quality indices were within the permissible limits suggested by different agencies,with the exception of EC,Cl-concentration,TA,turbidity,DO concentration,BOD5,and COD in all seasons.Statistical analyses indicated that 52%of the contrasts were significantly different at a 95%confidence interval.The factor analysis presented the best fit among the parameters,with four factors explaining 94.29%of the total variance.TDS,BOD5,COD,EC,turbidity,DO,and Cl-were mainly responsible for pollution loading and were caused by the significant amount of industrial discharge and toxicological compounds.The cluster analysis showed the seasonal change in surface water quality,which is usually an indicator of pollution from rainfall or other sources.However,the values of different physicochemical properties varied with seasons,and the highest values of pollutants were recorded in the winter.With the change in seasonal temperature and increase in rainfall,the seasonal Turag River water followed a self-refining trend as follows:rainy season> prewinter>summer>winter.
Keywords:Seasonal variation;Physicochemical parameter;Water quality;Factor analysis;Cluster analysis;Turag River
Access to clean and safe water for human consumption was declared a human right by the United Nations General Assembly in July 2016(UN,2016).Given that climate change and anthropogenic activities are leading to major alterations in the hydrological cycle,water quality degradation has become a crucial worldwide issue for the sustainable development of human beings.Water resources are under severe threats from pollution generated by human interventions and inappropriate agricultural drainage from rivers(Jin et al.,2020a,2020b).Anthropogenic sources such as untreated industrial effluents,improperly disposed domestic waste,and agricultural runoff are the prime contributors to surface water pollution and water quality deterioration(UN,2016;Uddin and Jeong,2021;Hasan et al.,2019).Seasonal variations in both anthropogenic and natural processes such as temperature and precipitation affect the quality of river water and lead to different attributes for different seasons(Vega et al.,1998;Islam et al.,2018;Barakat et al.,2016).
In Bangladesh,many industrial units are constructed beside rivers or other water bodies.Untreated effluent from factories is directly or indirectly discharged into rivers,causing pollution of surface water(Whitehead et al.,2018;Hasan et al.,2019).Both municipal solid waste and industrial effluents have adversely impacted the water quality of the rivers in Bangladesh to a large extent over the past few decades(Uddin and Jeong,2021;Islam et al.,2013;Hasan et al.,2019).
The Turag River is one of the rivers surrounding Dhaka,the capital city of Bangladesh.At present,this river is confronted with severe water pollution and environmental problems that have become a biological and hydrological deadlock(Whitehead et al.,2018;Uddin and Jeong,2021).Textile,rubber,cotton,resin,organic chemical,paper,and synthetic drug factories,as well as oil refineries,tanneries,and dense settlements have proliferated around this river(BIWTA,2019).Kant(2012)reported that 72 toxic chemicals were identified in untreated water from textile dyeing,30 of which cannot be removed by treatment with current technology.The Turag River has become a dumping ground of all types of solid,liquid,and chemical wastes by the residents along the river(Uddin and Jeong,2021;Islam et al.,2018).Consequently,a complex mixture of multiple organic and inorganic hazardous chemicals from industries together with domestic waste is released into the Turag River and exacerbates water quality deterioration.During the dry season with low flows,the water level decreases,and the water condition worsens in comparison with that during the wet season(Ahmed et al.,2016).
Monitoring of the physicochemical water quality parameters plays a pivotal role in assessing the water environment,ecosystem,hydrochemistry,and ecology,and restoring water quality(Whitehead et al.,2018;Sarkar et al.,2016;Islam et al.,2019).Recently,in accordance with the Action Plan of the Government of Bangladesh,the Turag River has been protected from illegal encroachment and dredging is being done in order to improve river flow,remove riverbed waste,and create waterway circulation for transportation and recreation in Dhaka City(BIWTA,2019).Several previous studies(Tahmina et al.,2018;Machender et al.,2013;Islam et al.,2019;Hafizur et al.,2017;Barakat et al.,2016;Jolly et al.,2018)have been carried out using multivariate statistical techniques to assess seasonal variation of surface water quality in different periods,in terms of water quality parameters,physicochemical properties,and river toxicity.Given that variation in water quality is a continuous process,updated water quality data are necessary for water quality assessment.Therefore,this study aimed at evaluating the temporal(mainly seasonal)variation of physicochemical properties of the Turag River water.To achieve these objectives,this study conducted a post-hoc analysis,matrix correlation analysis,varimax rotation factor analysis,and cluster analysis to determine the relationship among different water quality variables,the similarity and the best fit among water property parameters with their sources,and whether or not different seasons show the same properties.
2.1.Study area
The Turag River,which is commercially important and navigable all year round,has a typical river ecosystem in the tropical flood-prone region of Bangladesh(Fig.1).The study area lies in the Madhupur Tract,which is a Pleistocene landscape separated from the surrounding fluvio-deltaic plains by the Ganges,Brahmaputra,and Meghna rivers(Hossain et al.,2012).The Turag River originates from the Bangshi River,which is an upper tributary of the Buriganga River,and flows through the northern region of the Dhaka megacity.
2.2.Land use and land cover information
Rapid land use transformation from agricultural land to urban land on the outskirts of Dhaka City,especially along the Tongi Khal of the Turag River,is visible through multispectral satellite data over the past few decades(Dewan et al.,2012).Improved sanitation coverage in the newly converted urban areas is yet to be developed.The current system is a combined drainage and sewage system.A convergence of uncontrolled industrial growth,dense infrastructure,urban migration,ineffective enforcement of environmental regulations,and unclear institutional responsibility for water quality management have all taken their toll on surface water quality(Whitehead et al.,2009,2018).Sayed and Haruyama(2016)observed notable changes in the land-use patterns in Dhaka City using remote sensing and described almost 20%industrial growth of the city between 2004 and 2010,with an increase of 5%in the total number of brickfields,another major source of water and air pollution.Dhaka,one of the most crowded cities in the world,with a population of nearly 16 million,has only 25%of its urban area served by sewage treatment facilities(Whitehead et al.,2018).Without a proper waste management system,over 50%of municipal waste has been disposed into the water bodies of Dhaka City.However,due to the rapid pace of change,obtaining accurate information about effluent loads from various sources along the river is a challenge(Whitehead et al.,2018).The east bank of the Turag River in the Tongi area is highly industrialized and surrounded by a large number of brickfields,as well as a dense residential population.On the other hand,the west river bank is mainly used for crop cultivation.
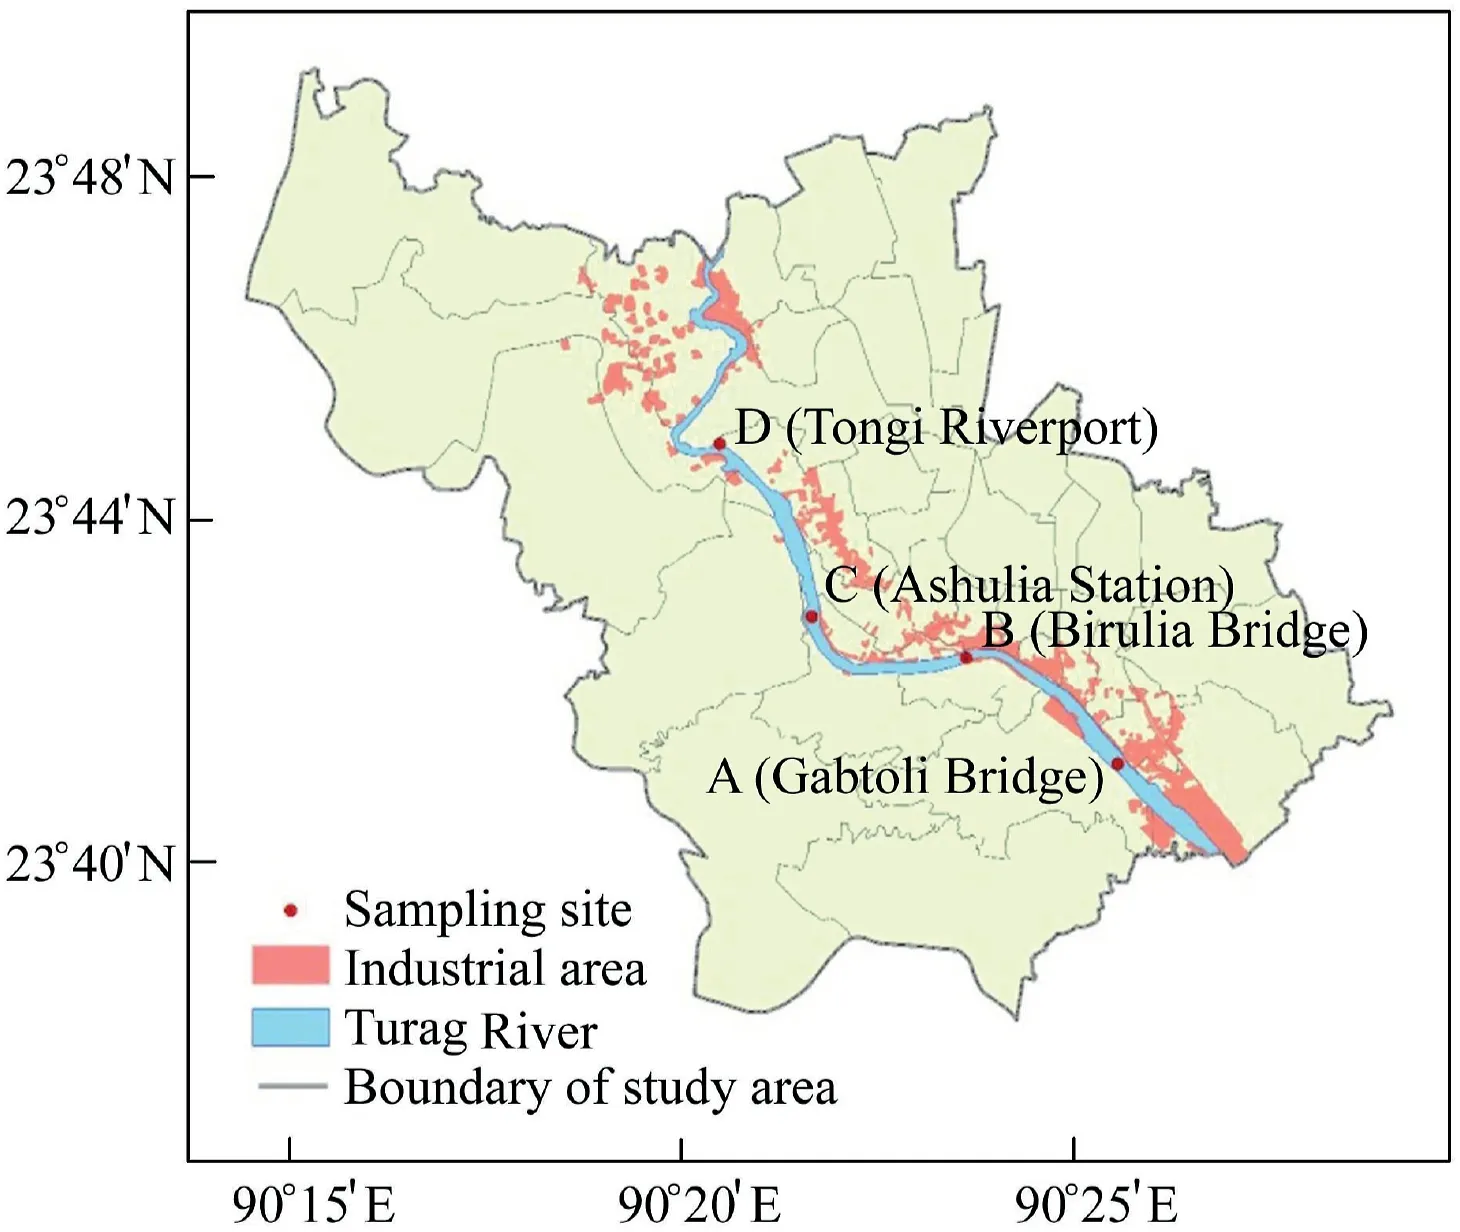
Fig.1.Map of study area and sampling sites in Turag River.
2.3.Water sample collection and processing
Water samples were collected at four sites,which are near the Gabtoli Bridge,beside the Birulia Bridge,at Ashulia Station,and opposite the Tongi Riverport(Fig.1).Water samples(approximately 1 000 mL each)were collected in four distinct seasons:winter(December-February),summer(March-May),the rainy season(June-August),and pre-winter(September-November).Sample collection was conducted 12 times at an interval of 30 d from December 2018 to November 2019.Water samples were collected at each point in the midstream and at the water depth of approximately 10-20 cm during the low tidal period.A portion of each collected sample was filtered through Whatman 41 filter paper to separate suspended solids,and the samples were used to determine five-day biochemical oxygen demand(BOD5)and chemical oxygen demand(COD).After sampling,an alkaline potassium iodide solution was added to protect water samples from any fungal or other pathogenic attacks.The bottles were kept airtight,labelled properly,brought to the laboratory,and preserved properly in the refrigerator until subsequent analysis.
2.4.Analytical methods
Twelve important parameters were selected for physicochemical water quality analysis:temperature,turbidity,total dissolved solids(TDS),total suspended solids(TSS),pH,electrical conductivity(EC),chloride ion(Cl-)concentration,total alkalinity(TA),total hardness(TH),dissolved oxygen(DO)concentration,BOD5,and COD.The temperature,pH,and EC of the water samples were instrumentally measured in situ with a mercury thermometer and a glass electrode pH and EC meter,respectively(APHA,2005).Water depth was observed using a meter scale,and TH of water was determined through titration with an EDTA conjoining Eriochrome Black-T indicator(APHA,2005).TA was measured as CaCO3through titration with a bromocresol green-methyl red indicator(APHA,2005).Turbidity,Cl-concentration,and DO concentration were determined with a turbidity meter,with the standard method of APHA(2005),and with a DO meter with a luminescent DO probe,respectively.TSS were obtained gravimetrically by filtration and thereafter dried in an oven(Radojevic and Bashkin,1999).TDS concentration was rapidly measured with a TDS meter.BOD5was determined through the five-day dilution method(Klein and Gibbs,1979).COD was determined with a United States Environmental Protection Agency(USEPA)micro-digestion reactor and the colorimetric method(Jirka and Carter,1975).Each analysis was carried out in triplicate,and the mean value was adopted.
3.1.Physicochemical properties of water
The physicochemical parameters,such as temperature,pH,DO concentration,BOD5concentration,COD concentration,EC,Cl-concentration,TA,turbidity,TDS concentration,TSS concentration,and TH,were recorded at points A,B,C,and D(Fig.1)for different seasons and are shown in Table 1.
The mean temperature of the collected water samples at the four points ranged from 20.8°C to 28.8°C(Fig.2).Seasonal mean temperatures with respect to their seasonal variation for the four seasons were(21.92±0.08)°C,(26.62±0.15)°C,(25.90 ± 0.02)°C,and (23.39 ± 0.12)°C,respectively(Table 1).According to the standards of the Department of Environment in Bangladesh(DoE,1997),the Department of Public Health Engineering(DPHE,2019),the World Health Organization(WHO,2017a),and the USEPA(2012)(Table 2),these values were acceptable for aquatic life and household activities,including drinking purposes.Afrin et al.(2015)reported that the temperature of the Turag River ranged from 23.20°C to 31.90°C from January to March,which agreed with the findings of this study.Temperature variation in the Turag River water may not act as a limiting factor for the survival of aquatic populations and the biotic community(Whitehead et al.,2009;Islam et al.,2019).There was a significant difference(Table 3)among the seasonal temperature at a confidence interval of 95%.According to the Duncan"s multiple range test(DMRT),the p values for all the contrasts(winter versus rainy season,winter versus pre-winter,winter versus summer,summer versus rainy season,summer versus pre-winter,and pre-winter versus rainy season)were less than 0.000 1.Water temperature may not be as important in pure water because of the wide range of temperature tolerance in aquatic life.However,in polluted water,water temperature can have a profound effect on DO(Machender et al.,2013;Ahmed et al.,2016).
The mean pH values varied from 6.11 to 8.37(Fig.2),which indicated that the water was slightly acidic to alkaline.Afrin et al.(2015)and Ahmed et al.(2016)observed that the pH values of the Turag River water ranged from 6.98 to 7.93 and from 7.2 to 8.0,respectively,which were basically consistent with the values found in this study.According to Table 1,the seasonal mean pH value with respect to its seasonal variation was within the permissible limit(Table 2)for diverse uses such as irrigation,domestic purposes,and recreational purposes.The normal range of pH for surface water systems is 6.5-8.5,and the optimum limit for irrigation and fish culture is from 6.5 to 8.0(DoE,1997).Parker et al.(1992)reported the influence of water acidity on the presence of fish and aquatic invertebrates in order to shed light on how these variables might influence the distribution of waterfowl in the freshwater system.Their observations revealed that piscivores were abundant with a pH of 5.5,whereas insectivores/omnivores exhibited no selection for freshwater systems with specific acidity.In the present study,pH was slightly different in winter,but it was fairly consistent in other seasons.The pHvalues remained at around 7.Therefore,pH does not act as a limiting factor in the distribution of aquatic populations except in winter.The highest seasonal pH value in the Turag River was 8.09±0.11 in winter,and the lowest was 6.74±0.15 in summer(Table 1).Significant variation of pH occurred among different seasons(Table 3),and the p values were lower than 0.000 1 for all the contrasts except pre-winter versus rainy season with a p value of 0.023 7.

Table 1 Mean values and standard deviations of physicochemical properties of Turag River water in four distinct seasons recorded at four stations from December 2018 to November 2019.
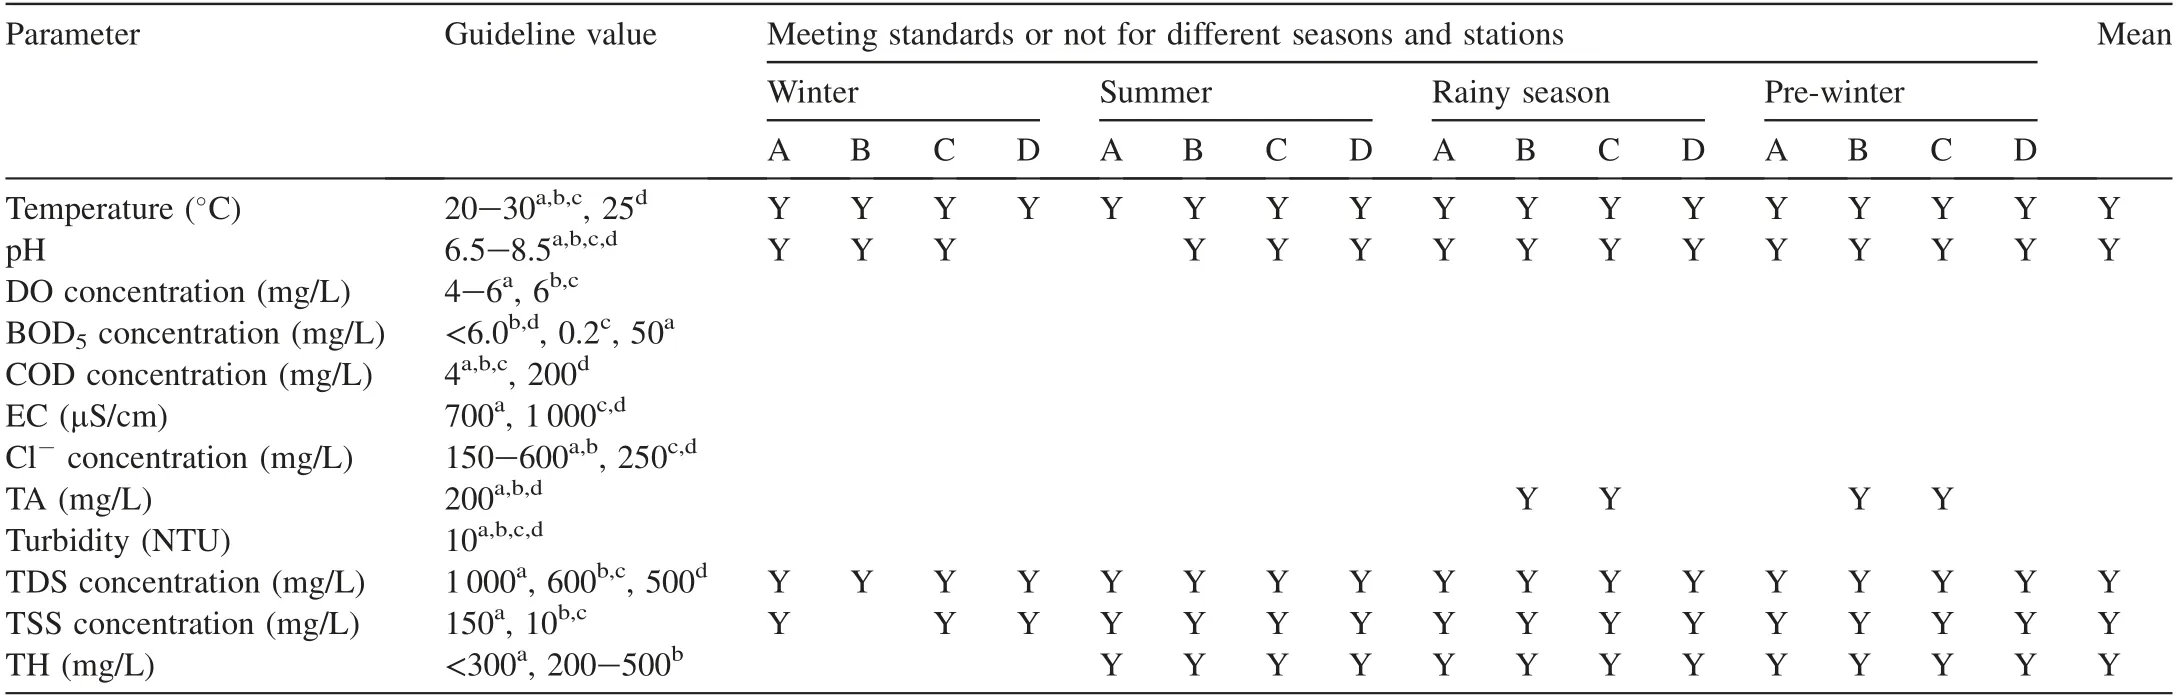
Table 2 Comparison of water quality parameters with standards for drinking,domestic,and irrigation purposes.
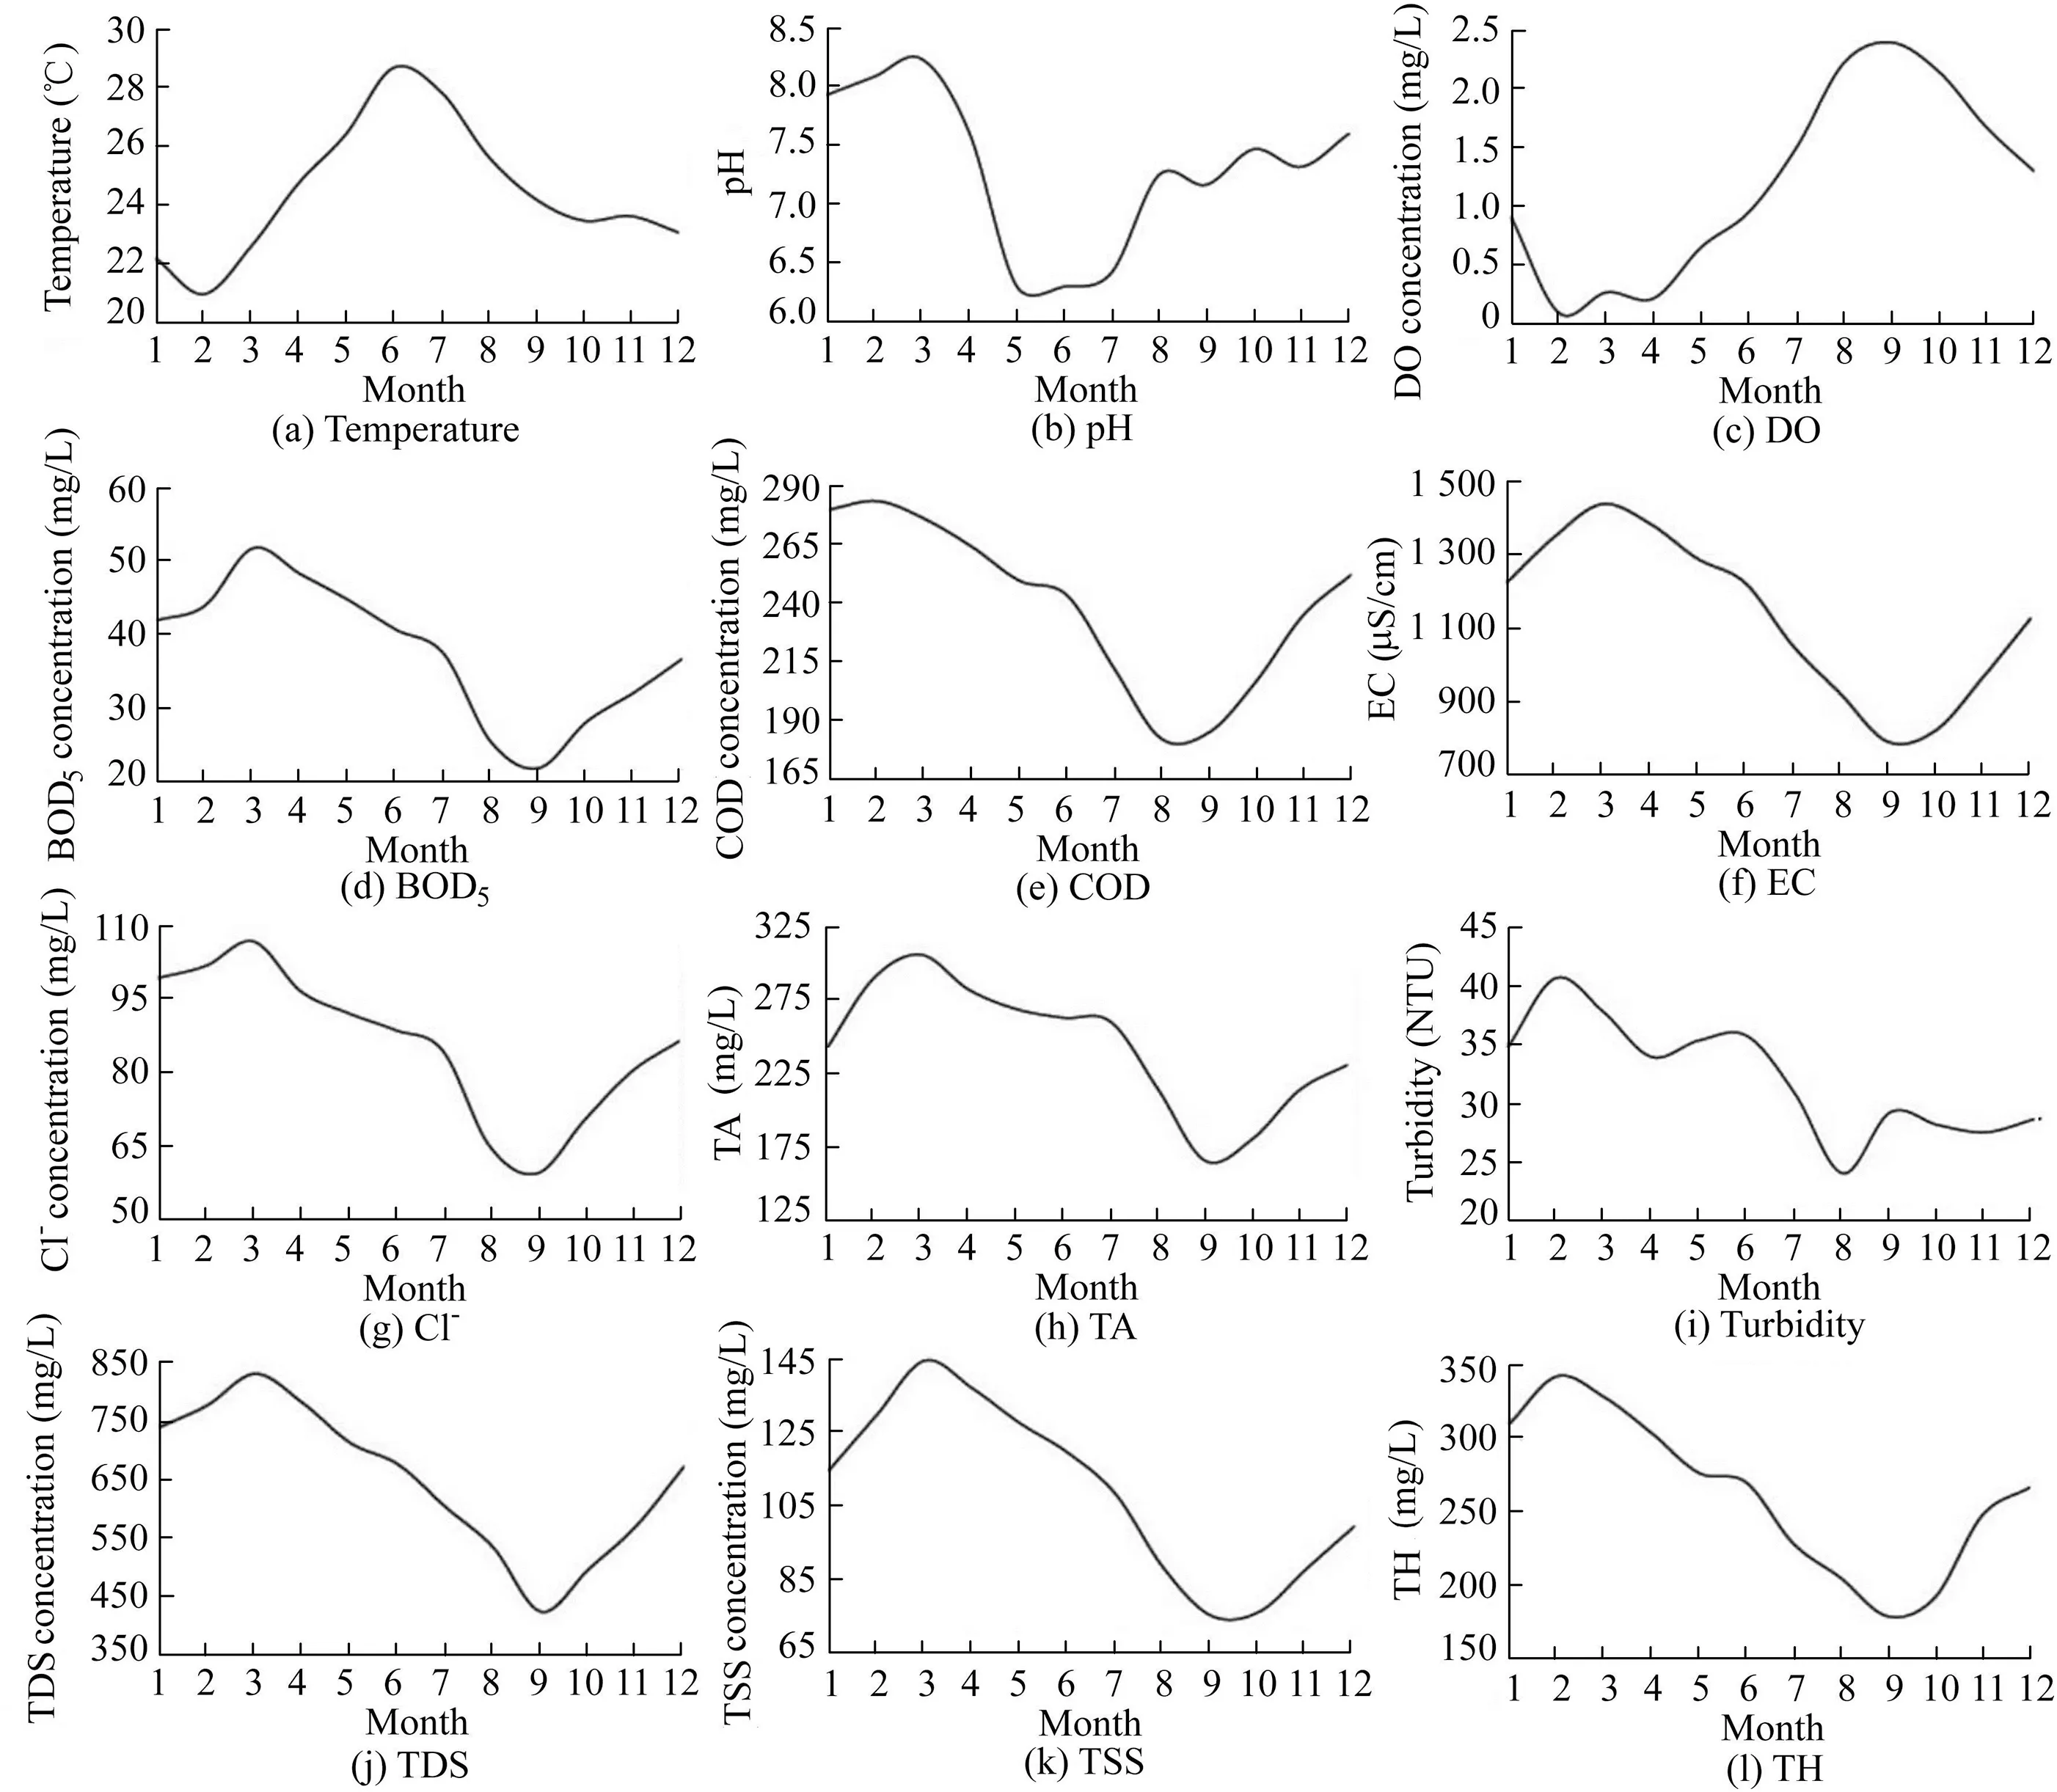
Fig.2.Temporal variation of physicochemical properties of water in Turag River from December 2018(month 1)to November 2019(month 12).
The mean turbidity of the collected water samples from the four points was within the range of 24.48-41.10 NTU(Fig.2).Bhuiyan et al.(2011)found that the highest mean turbidity of the Turag River water was 27.41 NTU,and the present study showed higher values.The seasonal mean turbidity values with respect to their seasonal variation for the four seasons were(37.83±2.28),(35.11±1.09),(28.12±1.31),and(28.19±1.46)NTU,respectively(Table 1).All values have exceeded the permissible limit reported by DoE(1997),DPHE(2019),and USEPA(2012)(Table 2)for drinking and irrigation purposes.There was no significant difference(Table 3)among the seasonal values of turbidity except the two contrasts,where the p values for winter versus rainy season and winter versus pre-winter were estimated to be 0.017 6 and 0.042 0,respectively,according to DMRT at a confidence interval of 95%.
The mean Cl-concentration of the collected water samples at the four points was within the range of 61-107 mg/L(Fig.2).As reported by DoE(1997),the concentration of Clranged from 6.0 to 119.7 mg/L and from 3 to 141 mg/L at different points in 2014 and 2016,respectively.According to Islam et al.(2018),the Cl-concentration of the Turag River surface water ranged from 80.74 to 137.37 mg/L,and the present study showed lower values.The permissible limits of Cl-concentration in surface water for drinking purposes are 150-600 mg/L according to DoE(1997)or 250 mg/L according to WHO(2017a).The mean values for points A,B,C,and D were(69.17±14.45),(114.42±20.39),(79.00±15.09),and(81.33±15.55)mg/L,respectively,all below the safe limit suggested by DoE(1997)and WHO(2017a,2017b)(Table 2).The highest seasonal Cl-concentration in the Turag River water was(132.00±10.82)mg/L in winter at point B,and the lowest was(52.00±14.73)mg/L in the rainy season at point A.According to DMRT,no significant difference appeared among the seasonal values of Cl-concentration at a confidence interval of 95%(Table 3).The sources of chloride in the Turag River water might be chlorinated pesticides and wastes discharged from industries and synthetic mills situated by the riverside(Whitehead et al.,2018).
The mean TAvalue of the collected water samples at the four points was within the range of 165-302 mg/L(Fig.2).The seasonal mean TAvalues with respect to their seasonal variation for the four seasons were(281.16±23.70),(273.16±4.01),(215.10±17.10),and(210.05±20.34)mg/L,respectively(Table 1),which were higher than the permissible limit of the standards shown in Table 2.Afrin et al.(2015)observed that the TA values of the Turag River water ranged from 104.54 to 367.33 mg/L,and the present value was higher than that in Afrin et al.(2015).The mean values for points A,B,C,and D were(333.58±40.34),(211.33±59.63),(202.92±49.49),and(231.50±43.72)mg/L.According to DMRT,there was no significant difference among the seasonal TAvalues at a confidence interval of 95%(Table 3).According to USEPA(2012),the standard TA value is higher than 100 mg/L.Most of the seasonal TAvalues of the water samples exceeded the standard limit,except a few values in pre-winter.It may be assumed that effluents from the drug industry,antibiotics factories,oil refineries,fertilizer factories,and synthetic mills are responsible for the TA increase in urban river water(Sharma,2003).
The mean ECof the analyzed water samples at the four points was within the range of 768.50-1 429.23μS/cm(Fig.2).Tahmina et al.(2018)found that the average EC values of the Turag River water were 1 568.75 and 1 376.25μS/cm in two distinct seasons(the wet and dry seasons,respectively).According to Hafizur et al.(2017),the seasonal EC values of the Turag River water recorded at different sampling points ranged from 728.75 to 1 980.00μS/cm.By contrast,this study demonstrated relatively lower EC values.This differences might be due to the seasonal variation,the different sampling points,and the tidal effects.The seasonal mean EC values for the Turag River water were(1 335.74±46.86),(1 297.91±34.34),(923.03±36.98),and(973.03±66.41)μS/cm(Table 1),which exceeded the permissible limits reported by DoE(1997)in terms of drinking(700μS/cm)and irrigation(1 000μS/cm)water.Therefore,the water was unsuitable for drinking,domestic,recreational,and agricultural purposes(Table 2).According to DMRT,there was a significant difference(Table 3)among the seasonal ECvalues at a confidence interval of 95%,except for two of the contrasts(winter versus summer and pre-winter versus rainy season),and the p values for all significant contrasts(winter versus rainy season,winter versus pre-winter,summer versus rainy season,and summer versus pre-winter)were lower than 0.000 1.The ECdecline in the Turag River water during the rainy and pre-winter seasons might result from water dilution by rainfall.
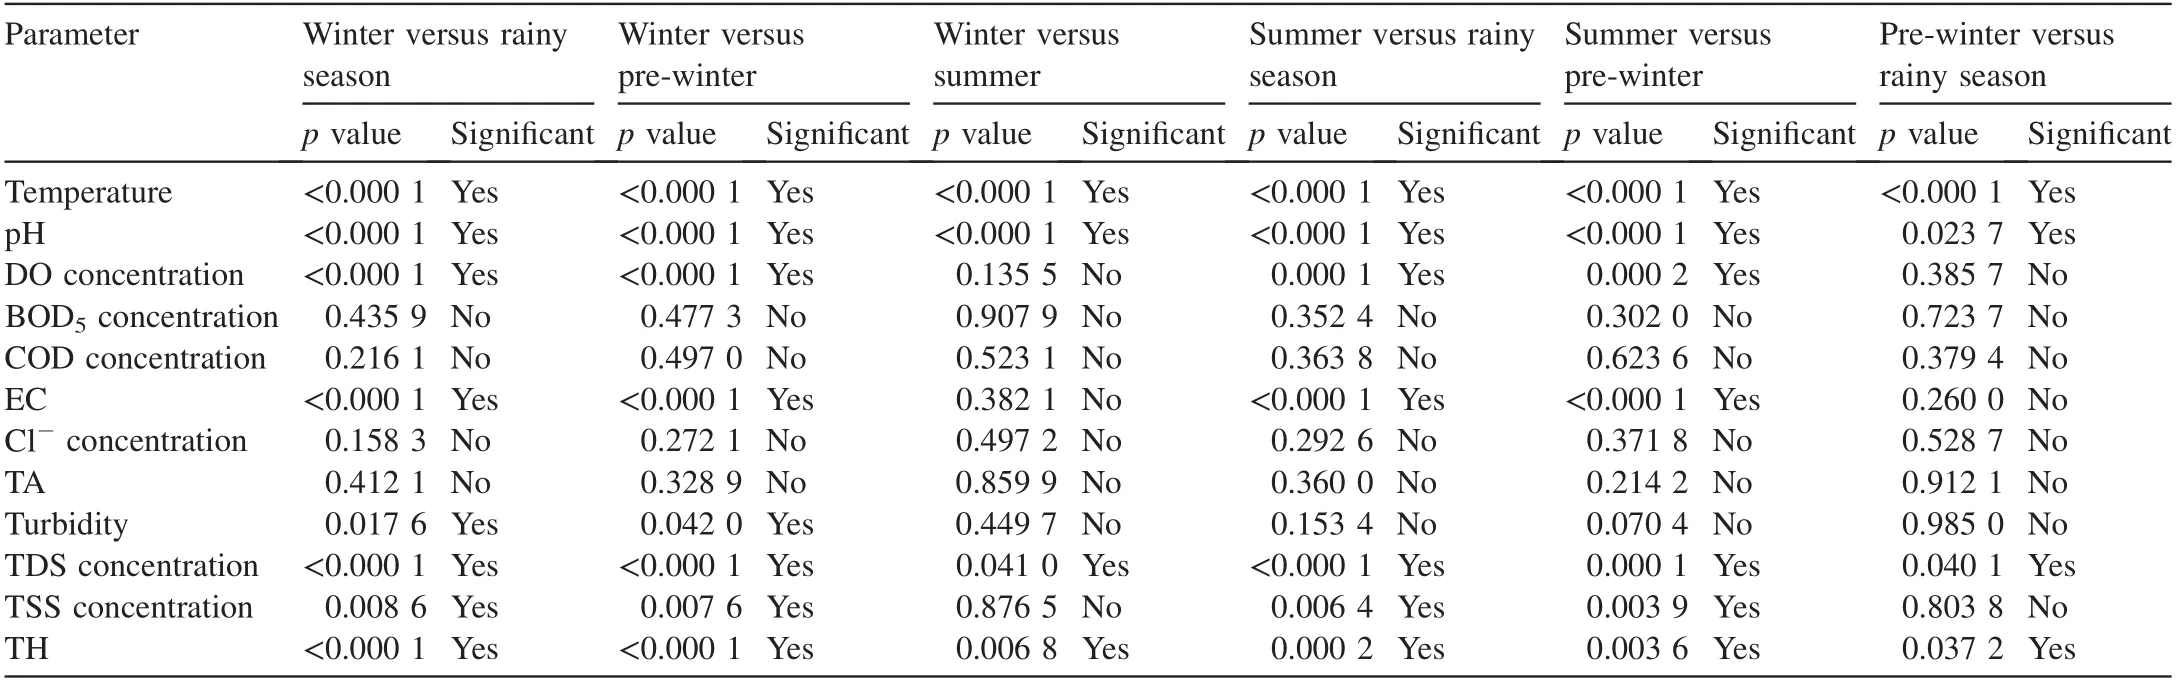
Table 3Analysis of differences of water quality parameters in different seasons using DMRT at a 95%confidence interval.
The TDS concentration of the collected water samples in the four different seasons was within the range of 425-832 mg/L(Table 1).According to Moniruzzaman et al.(2009)and Aktar et al.(2017),TDS concentration of the Turag River water ranged from 167 to 435 mg/L and 582-655 mg/L,respectively.This study presented mostly higher TDS during the summer and winter seasons.Higher TDS was found in the dry season.This shows that discharged toxicological additives might pollute the river water at a high rate because rainfall was very low in winter.The seasonal mean TDS values for the Turag River water were(782.08±18.97),(722.50±9.90),(519.66±21.81),and(579.58±27.60)mg/L,respectively(Table 1).This might be due to the high flow,precipitation,and dilution by rainfall.According to WHO(2017a,2017b),USEPA(2012),and DPHE(2019),the maximum limits of TDS for drinking water are 600,500,and 600 mg/L respectively.Thus,most of the TDS values exceeded the permissible limits.Given that the acceptable TDS limit for irrigation is 2 000 mg/L,it can be stated that the Turag River water was unsuitable for domestic purposes such as bathing and drinking.However,it was compatible with the irrigation purpose(DoE,1997).Additionally,the high TDS load cannot effectively reduce the nutrient load of urban wastewater,which leads to deterioration of the water quality of the Turag River(Brar et al.,2017).According to DMRT,the seasonal TDS values were in a significant difference at a 95%confidence interval(Table 3).The p values were lower than 0.000 1 for the contrasts of winter versus rainy season,winter versus pre-winter,and summer versus rainy season.Those for summer versus pre-winter,winter versus summer,and pre-winter versus rainy season were 0.000 1,0.041 0,and 0.040 1,respectively.A relationship between TDS and EC was found(Table 4):as TDS values increased,the EC values increased,and with the decrease of TDS values,the EC values decreased as well.
The mean TSS concentration of the collected water samples at the four points was within the range of 75-145 mg/L(Fig.2).Aktar et al.(2017) reported higher TSS concentrations(257-265 mg/L)in the Turag River water.They reported that industrial wastewater directly fell into the river through pipes,canals,open drains,etc.and polluted the river water,which might be the reason for the higher TSS concentrations.The seasonal mean TSS concentrations were(127.83±6.48),(128.83±4.20),(90.08±7.05),and(87.41±3.86)mg/L,respectively(Table 1),and they were within the permissible limits according to DoE(1997).The analyzed TSS values were much higher than that of the drinking standard according to DPHE(2019)and WHO(2017a)(Table 2).The TSS values in different seasons significantly varied(Table 3),except for two of the contrasts(winter versus summer and pre-winter versus rainy season),and the p values for the significant contrasts of winter versus rainy season,winter versus pre-winter,summer versus rainy season,and summer versus pre-winter,were less than 0.008 6,less than 0.007 6,0.006 4,and 0.003 9,respectively.
The mean TH of the collected water samples at the four points was within the range of 180-345 mg/L.The total mean values at the points A,B,C,and D were(265.25±31.87),(249.25±39.80),(272.92±24.46),and(266.00±33.65)mg/L,respectively(Fig.2).According to the standards shown in Table 2,all these values were within the permissible limit,except for that of the winter season.The highest seasonal TH in the Turag River water was(328.00±10.40)mg/L in winter,and the lowest was(204.83±4.83)mg/L in the rainy season(Table 1).Aktar et al.(2017)and Tahmina et al.(2018)also showed mostly similar highest values at different points in the Turag River,indicating that the river water was not suitable for different household activities and drinking.Sawyer and McCarty(1967)classified the river water as soft(<75 mg/L),moderately hard(75-150 mg/L),hard(150-300 mg/L),and very hard(>300 mg/L).According to these criteria,the Turag River water can be graded as moderately hard to hard water in summer and rainy season.According to DMRT,there was a significant difference among the seasonal TH values at a 95%confidence interval(Table 3),and the pvalues for the contrasts of winter versus rainy season,winter versus pre-winter,winter versus summer,summer versus rainy season,summer versus pre-winter,and pre-winter versus rainy season,were<0.000 1,<0.000 1,0.006 8,0.000 2,0.003 6,and 0.037 2,respectively.Strong relationships were found between TH and other water properties(Table 4),which illustrated the complex pollution status of the Turag River.
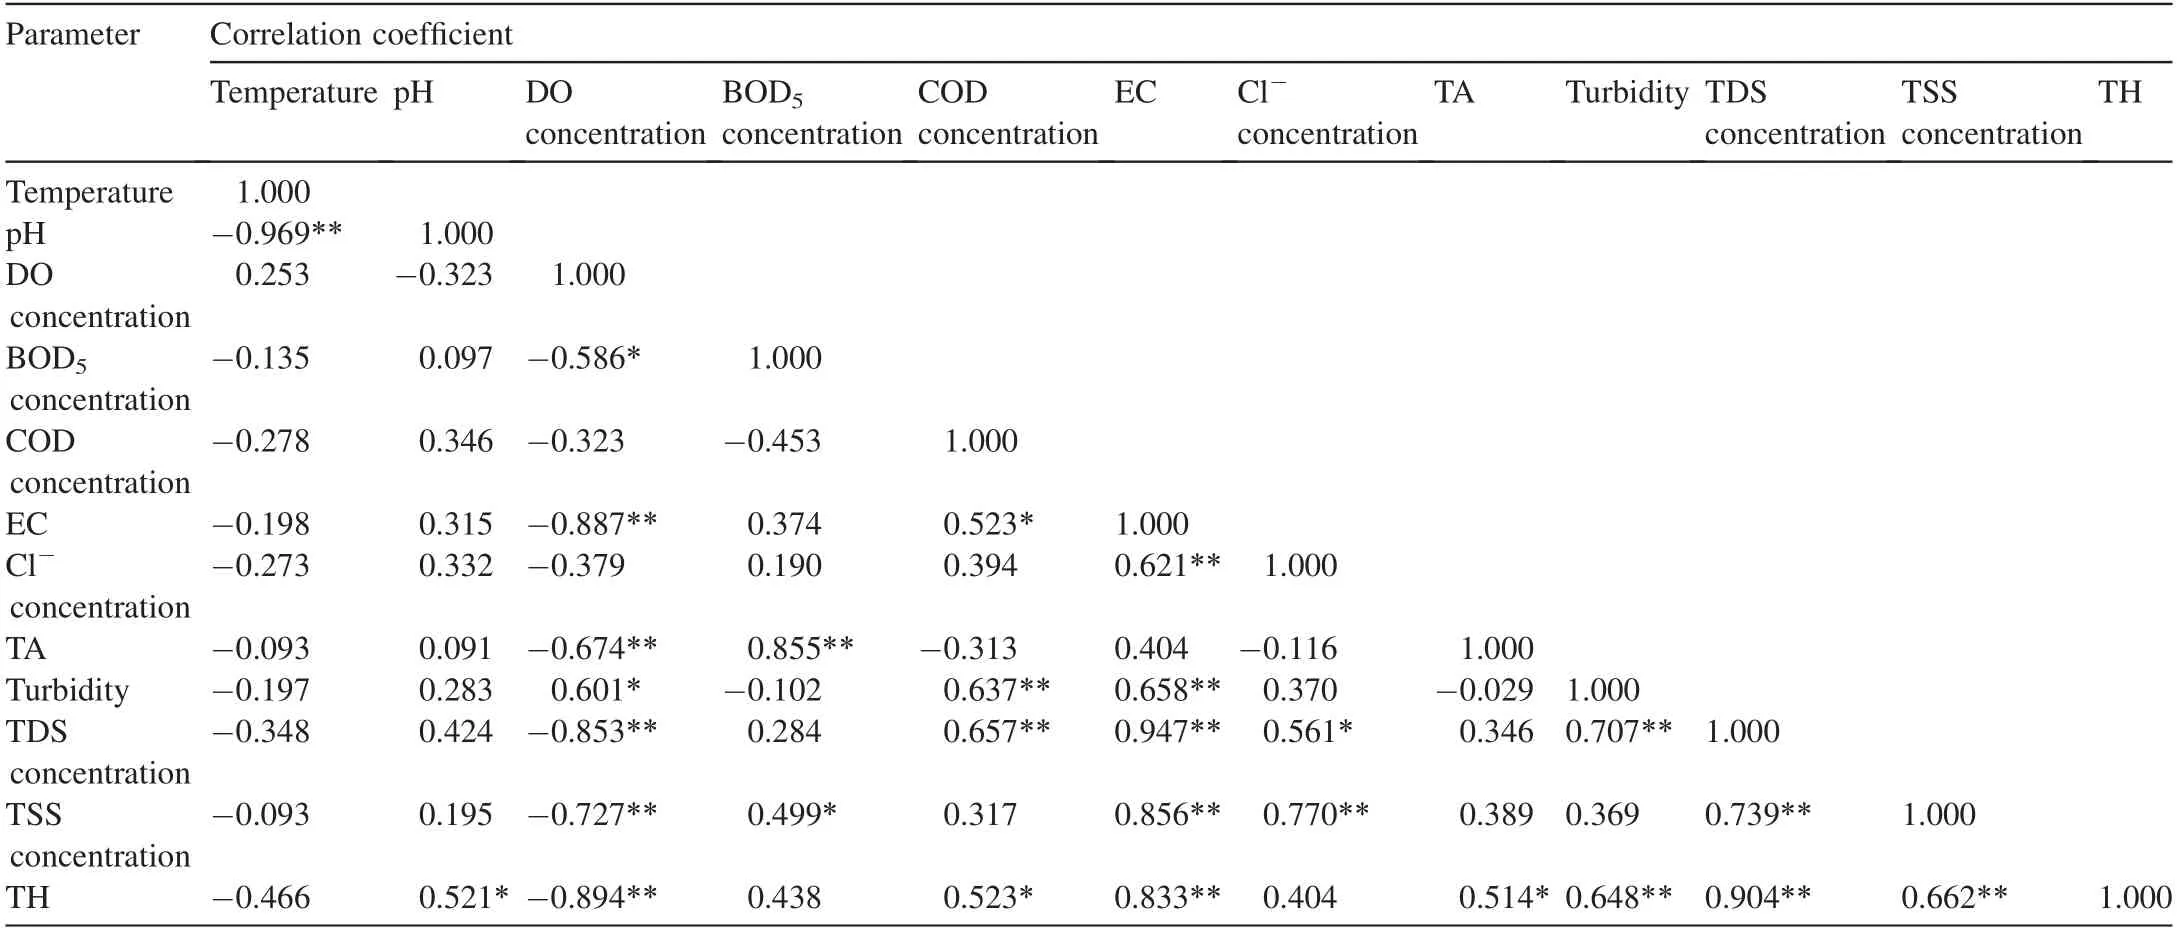
Table 4 Correlation among all water quality parameters.
3.2.Chemical properties of water
The mean DO concentrations of the collected water samples at the four points varied from 0 to 2.40 mg/L(Fig.2).The present study demonstrated zero DO concentration in the Turag River for the winter season.Such a low value does not bolster the survival of aquatic life(Uddin and Jeong,2021).The following requirements for DO concentration are endorsed:6 mg/L for drinking water,4-5 mg/L for entertainment,4-6 mg/L for fish and domesticated animals,and 5 mg/L for industrial applications(WHO,2017a,2017b;DoE,1997;DPHE,2019).Hence,the Turag River water was almost unsuitable for those purposes.The diminishment of DO might result from the industrial wastewater discharged from the Tongi industrial area as well as the municipal waste loads,which require a higher level of oxygen for chemical oxidation and decomposition(Whitehead et al.,2018).This generates elevated anoxic conditions,a deficiency of nutrient availability,and an increase of organic substances loading and pathogens in water(Whitehead et al.,2018;Uddin and Jeong,2021;Tahmina et al.,2018;Islam et al.,2018).Seasonal DO concentrations were(0.42±0.09),(0.60±0.20),(2.04±0.23),and(1.70±0.35)mg/L,respectively(Table 1),and all these values were much lower than the permissible limits shown in Table 2.According to these seasonal and point-based observations,it can be stated that the DO level in the upper reach of the river was higher than that in the lower reach,due to the water movement.The growth and decay of floating and submerged aquatic microphytes further contributes to the decrease in the DO level(Hasan et al.,2019).According to DMRT(Table 3),the seasonal DO values significantly varied at a 95%confidence interval,except for two contrasts(winter versus summer and pre-winter versus rainy season),and the p values for the significant contrasts of winter versus rainy season,winter versus pre-winter,summer versus rainy season,and summer versus pre-winter were<0.000 1,<0.000 1,0.000 1,and 0.000 2,respectively.
With lower DO concentrations,BOD5at 20°C is high due to the high oxygen demand by microorganisms.The mean BOD5concentrations of the collected water samples at the four sampling points were within the range of 20-52 mg/L(Fig.2).By contrast,the Bangladeshi standard does not allow BOD5concentration to exceed 0.2 mg/L in drinking water(DoE,1997).Ahmed et al.(2016)recorded the highest BOD5concentration of 31 mg/L at the Tongi Station in the Turag River,and Aktar et al.(2017)recorded a BOD5concentration of 13-73 mg/L near a major industrial area.The findings of this study are similar to those of previous studies.The high BOD5level indicates the presence of excessive bacteria/microorganisms in the water,which might come from industrial and domestic wastewater that consumed the dissolved oxygen with increased biochemical oxygen demand in the river water(Whitehead et al.,2009;Hasan et al.,2019).The mean BOD5concentrations in the four seasons were(45.66±2.42),(44.33±2.07),(28.08±3.45),and(32.16±2.58)mg/L,respectively(Table 1),and they all exceeded most of the permissible limits listed in Table 2.Thus,the water was unsuitable for drinking and domestic purposes.Similar findings were reported by Islam et al.(2015).According to DMRT,there was no significant difference among the seasonal BOD5values at a 95%confidence interval(Table 3).
The mean COD concentration in the present study varied between 180 and 382 mg/L(Fig.2),which was higher than that reported by Banu et al.(2013)(102 mg/L).This might be due to the industrial and municipal discharge loads.In the dry season(summer),the water flow declines,and therefore the growth of microorganisms increases profoundly,providing another potential source of the high COD values(Sarkar et al.,2016).Additionally,organic chemical industries,pesticide industries,distilleries,and dyeing factories deteriorate the COD pollution in the river water(Sharma,2003).The seasonal mean COD values for seasonal variation at the four sampling points were(280.75±5.84),(253.12±5.47),(193.25±6.35),and(231.75±9.20)mg/L(Table 1).The permissible limit of COD for drinking purposes is within 4 mg/L according to the standards of DoE(1997),DPHE(2019),and WHO(2017a,2017b)(Table 2).USEPA(2012)determines the irrigation standard at 200 mg/L.It can be stated that the Turag River water was inappropriate for drinking as well as for agricultural purposes(Islam et al.,2015).The highest seasonal COD concentration in the Turag River was(338.67±20.84)mg/L in winter at the Tongi Riverport sampling point,and the lowest was(121.00±28.21)mg/L in the rainy season at the Gabtoli Bridge sampling point.There was no significant difference among the seasonal COD values at a 95%confidence interval(Table 3).
3.3.Multivariate statistical approaches
3.3.1.Correlation matrix
Table 4 shows the correlation coefficients(r)of all studied parameters,with their significance level(the p values).Water temperature had a strong negative correlation with pH(r=-0.969 and p<0.01).Temperature did not show any noticeable relationship with other parameters.pH positively correlated with TH(r=0.521 and p=0.05),and pH did not significantly correlate with other parameters.DO showed a negative correlation with all parameters except temperature and turbidity.In particular,DO had a significant negative correlation with BOD5(r=-0.586 and p=0.05),EC(r=-0.887 and p<0.01),TA(r=-0.674 and p<0.01),turbidity(r=0.601 and p=0.05),TDS(r=-0.853 and p<0.01),TSS(r=-0.727 and p<0.01),and TH(r=-0.894 and p<0.01).BOD5presented a strong positive correlation with TA(r=0.855 and p<0.01)and a weak positive relation with TSS(r=0.499 and p=0.05).COD was positively correlated with EC(r=0.523 and p=0.05),turbidity(r=0.637 and p<0.01),TDS(r=0.657 and p<0.01),and TH(r=0.523 and p=0.04),and no notable negative correlation was found.EC significantly and positively correlated with COD(r=0.523 and p<0.05),chloride(r=0.621 and p=0.01),turbidity(r=0.658 and p<0.01),TDS(r=0.947 and p<0.01),TSS(r=0.856 and p<0.01),and TH(r=0.833 and p<0.01).Chloride showed a significant positive correlation with EC,TDS(r=0.561 and p=0.05),and TSS(r=0.770 and p<0.01).TA was significantly correlated with DO(r=-0.647 and p<0.01),BOD5(r=0.855 and p<0.01),and TH(r=0.514 and p=0.05).Turbidity showed a significant positive correlation with COD,EC,DO(r=0.601 and p<0.05),TDS(r=0.707 and p<0.01),and TH(r=0.648 and p<0.01).TDS showed a significant positive correlation with TSS(r=0.739 and p<0.01)and TH(r=0.904 and p<0.01),and TSS showed a significant positive correlation with TH (r= 0.662 and p<0.01).The results of this study indicated that temperature and pH,DO and EC,DO and TDS,DO and TH,BOD5and TA,EC and TDS,EC and TSS,EC and TH,and TDS and TH were highly correlated.
3.3.2.Factor analysis
Factor analysis is a multivariate statistical method that shows the relationship among measured variables by reducing them to fewer numbers of factors.To find the best fit and clarify the relationship among factors,a varimax rotation factor analysis was performed(Table 5).Statistically,four factors were extracted that explained 94.29%of total variance with their eigenvalues higher than 1.0:51.69%for factor 1,20.39%for factor 2,13.79%for factor 3,and 8.42%for factor 4.The variables COD,EC,turbidity,TDS,and TH showed high positive loading,and DO showed high negative loading on factor 1(Table 5).Only DO showed negative loading with other parameters,which means that with the decrease of DO concentration,the concentration of the other parameters will increase.The variables BOD5and TA showed very high positive loading values on factor 2,whereas DO showed negative loading against BOD5on the same factor.Thus,with anincrease of TA,BOD5will increase,and BOD5will also increase with the decrease of DO concentration.The significant negative correlation between DO and BOD5in Table 4 also supports this.Temperature showed a high negative value while pH showed a high positive value on factor 3.Cl-and TSS concentrations were found to have positive loading on factor 4,which means that with an increase of TSS concentration,Clconcentration will also increase.High COD,EC,BOD5,and TA values result from the same sources,mainly from anthropogenic sources.There is also a strong correlation between these variables(Table 4),which further indicates that they come from the same sources.

Table 5 Varimax rotation factor analysis for physicochemical parameters.
3.3.3.Cluster analysis
Cluster analysis was employed for the normalized data with Ward"s method,using squared Euclidean distances as a measure of similarity.Ward"s method defines the proximity between two clusters as the increase in the squared error.The hierarchical cluster analysis was used to identify the similarity between different sampling months of the four seasons.The dendrogram(Fig.3)for the 12 months(from December 2018 to November 2019)using Ward"s linkage method and squared Euclidean distances showed three statistically significant clusters.The first cluster consisted of two months(August and September).Those months showed comparatively higher concentration of all parameters.The second cluster consisted of June,July,October,and November.These months were in the rainy/monsoon and post-monsoon seasons.In these sampling months,relatively lower concentrations of water quality parameters were found.This may be due to the higher dilution and flushing effect of rainfall.The third and final cluster consisted of the sampling months of December,January,February,March,April,and May.These months showed comparatively higher concentration of all parameters than other months.Given that these months mainly consisted of winter,late winter,and summer,lower water flow with high concentrations of water properties usually occurred.Water quality in winter is a product of the mixed origin of natural flow,effluent discharge,and surface runoff.Similar seasonal variation using the multivariate statistical approaches was reported by Barakat et al.(2016).
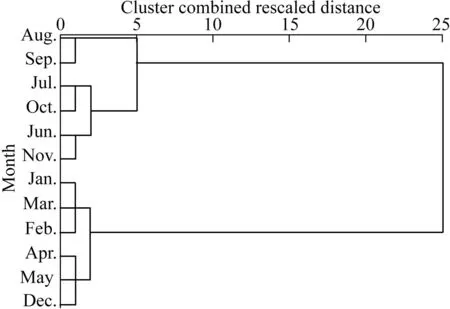
Fig.3.Dendrogram using hierarchical clustering of sampling months of water collection.
In this study,seasonal variations of water quality were studied to evaluate the extent of water pollution in the Turag River.It was found that the water pollution was mainly caused by anthropogenic sources.This finding was supported by the strong correlation between many examined variables.Multivariate statistical methods,including Pearson"s correlation,factor analysis,and cluster analysis,were performed to evaluate the seasonal variations of surface river water quality data.All the water quality parameters reached their individual highest deteriorated states in winter,with low DO concentration and high values of pH,turbidity,Cl-,TA,BOD5,COD,EC,TDS,and TH.The seasonal cluster analysis also indicated that the months in winter exhibited higher concentrations of all parameters than other seasons did.According to DMRT,52%of the contrasts were significantly different,while all contrasts of temperature,pH,TDS,and TH,as well as four contrasts of EC,turbidity,and TSS were significant at a 95%confidence interval.The COD values in the Turag River were quite high at all stations,indicating the high level of pollutants.The results revealed that the overall pollution level in the Turag River was beyond the safe limits in terms of the physicochemical and chemical properties of water.With the change in seasonal temperature and increasing rainfall,the Turag River water followed a self-refining seasonal trend as follows:rainy season>pre-winter>summer>winter.However,the lowest seasonal value in the rainy season as well as the seasonal mean of the Turag River water had undesirable mean values of DO(1.19 mg/L),BOD5(37.56 mg/L),COD(239.72 mg/L),EC(1 132.6μS/cm),chloride(86.01 mg/L),and turbidity(32.31 NTU)for intended uses.Pollution levels were likely to change due to the seasonal variations.The water quality indices showed that the studied river water suffered from severe water pollution.This study concluded that the Turag River water was not suitable for drinking,irrigation,entertainment uses,and aquatic lives in most seasons.Proper management of domestic and industrial wastes is required to lower the accumulation of pollutants in the Turag River and to minimize environmental degradation.
Declaration of competing interest
The authors declare no conflicts of interest.