Quantifying,water,quality,and,flow,in,multi-branched,urban,estuaries,for,a,rainfall,event,with,mass,balance,method
时间:2023-01-26 17:10:05 来源:柠檬阅读网 本文已影响 人 
Jon Cecili Csil ,Gush Azhikodn ,Ktsuhide Yokoym ,*
a College of Engineering and Agro-Industrial Technology,University of the Philippines Los Bañnos,Los Baños 4031,Philippines
b Department of Civil and Environmental Engineering,Tokyo Metropolitan University,Tokyo 192-0397,Japan
Received 2 December 2019;accepted 16 May 2020
Available online 9 December 2020
Abstract In this study,field observations were conducted after a heavy rainfall event in the Sumida and Shakujii rivers in Tokyo,Japan.The flow dynamics and fluxes of salt,suspended sediment(SS),and dissolved oxygen(DO)were investigated with the mass balance method.The fractions of fresh water and saltwater in seaward and landward flows were separated.The maximum salt flux in the Shakujii River was 53.8 kg/s during the flood tide,and those in the Sumida River were 680.3 kg/s at the upstream station and 703.7 kg/s at the downstream station.The trends of SS and DO fluxes were similar in both rivers.In the Shakujii River,the highest SS(3.1 kg/s)and DO(0.4 kg/s)fluxes appeared during the flood tide after rainfall.In the Sumida River,the maximum SS fluxes(6.1 and 6.3 kg/s at the upstream and downstream stations,respectively)and DO fluxes(1.15 and 1.21 kg/s at the upstream and downstream stations,respectively)appeared during the ebb tide.The mass balance method was used to estimate discharge,salinity,SS concentration,and DO concentration at a station with missing data.The results show that the estimated salinity and SS concentration had a significant correlation with the on-site observations,with correlation coefficients(R)of 0.950 and 0.835,respectively,but not for DO concentration(R=0.638).The disparity between the computed and measured data may be explained by the differences in velocity,salinity,topography,sedimentation,and the presence of organic matter.The analysis based on the advective salt transport components found a lower salt flux per unit width in the Shakujii River(0.36 kg/(m.s))in comparison with that in the Sumida River(2.88 kg/(m.s)).This indicates a higher probability for salt retention in the Shakujii River.© 2020 Hohai University.Production and hosting by Elsevier B.V.This is an open access article under the CC BY-NC-ND license(http://creativecommons.org/licenses/by-nc-nd/4.0/).
Keywords:Mass balance;Water quality;Flow;Salt transport;Sumida River;Shakujii River;Estuary
Rivers and estuaries are critical urban environmental resources that offer a variety of benefits.Clean and beautiful waterfronts are important for recreational opportunities,tourism,navigation,and the quality of life for urban residents in proximity to rivers.Many civilizations have developed along rivers.River resources are utilized for water supply,industry,transportation,etc.Urbanization transforms natural environments into human-impacted environments such as towns,cities,and harbours,leading to severe problems on water quality and human health.In many developing countries and regions,urban river systems are suffering from severe environmental degradation.Pollution caused by improper wastewater and garbage disposal aggravates water quality.To rationally evaluate,regulate,and manage water bodies,water quality standards have been developed by environmental protection authorities or agencies.
Industrial and domestic wastewater discharges deteriorate river water quality.The biochemical oxygen demand(BOD)in the Sumida River in Tokyo,Japan,was severely high(approximately 63 mg/L)in the early 1960s.On December 25,1970,the Water Pollution Control Law was enacted.Accordingly,the standard BOD value for rivers used for industrial water and environmental conservation(Class E)was set to be no higher than 10 mg/L(JEA,1973).In the mid-1980s,the BOD value in the Sumida River was reduced to below 10 mg/L.In 2003,the Sewerage Law Enforcement Order was amended,and the BOD value in the Sumida River further decreased to 2.1 mg/L in 2015.With the development of water treatment facilities and strict law enforcement,the waterfront environment of Tokyo has recovered and gained public popularity.Although water in urban areas is intensively monitored and measures are implemented to meet water quality standards,water pollution still occurs seasonally and periodically.
In urban estuaries,water quality deterioration and other water quality-induced problems are mainly caused by two factors:changes in fresh water supply and saltwater intrusion.As catchments undergo urbanization,flow regimes are expected to change remarkably.Urban stormwater sewer systems are feasible for supplementing or even completely replacing the natural channel system.They alter the drainage pattern of surface water with high flow velocities.In the case of storm conditions with the same magnitude and frequency in two catchments with the same drainage area,a higher volume of surface water is discharged from an urbanized catchment than from a catchment in a rural region(Hall,1977).Compared with urban areas,rural areas,which have natural water channel systems,have higher infiltration rates,allowing for more recharge to the groundwater.The organic matter is natural,and the sources of mineral particles are from forests and farmlands.
Urban catchments have higher proportions of impervious surfaces.Sewer systems alter the drainage pattern of surface runoff and carry organic matter from domestic and industrial wastewater.The decomposition of the organic matter leads to nuisance conditions such as the production of odorous gas and scum(Ma et al.,2016;Metcalf et al.,2003).Combined sewer systems are common in urban catchments.They carry the mixture of wastewater and storm runoff,collect receiving water,and occasionally overflow during heavy rainfall events when the maximum capacity of the interceptor is reached.A huge percentage of sediment are transported by storm discharge along with other constituents such as nutrients,organic and inorganic matter,particulates,and dissolved substances(Rankl,2004).The combined sewer overflows(CSOs)can result in high concentrations of microbial pathogens,solids,debris,and toxic pollutants in receiving water.They may lead to oxygen deficits through the input of degradable organic components(Mailhot et al.,2015).CSOs can impact the receiving water and prevent the attainment of water quality standards.
As a secondary factor,saltwater intrusion threatens potential water resources(Haddout et al.,2016).It plays a significant role in sediment transport and pollutant dispersion(Casila et al.,2017;Prandle,2009).According to salinity stratification,estuaries are classified as salt wedge or highly stratified,partially mixed or moderately stratified,and well mixed or vertically homogeneous estuaries.The nature of saltwater intrusion in urban estuaries is governed by tidal action,river flow,and topography(Becker et al.,2010;Dyer,1997;Hansen and Rattray,1966).In dry weather,the combined sewer systems collect wastewater that flows directly to treatment plants and then discharge into urban rivers as treated effluent.During rainfall,untreated water flows into rivers through the combined sewer systems and subsequently mixes with saline seawater in the river mouth.
Previous studies on flood events in Japan mainly focused on saltwater intrusion,spatiotemporal variation of water quality,and pollution load in a single river estuary(Biswas and Masudur,2011;Kaneko and Nihei,2012;Kazama and Ogura,2001;Kure et al.,2008;Tominaga et al.,2005).The multi-branched nature of hierarchical estuaries may lead to more complex phenomena(Perillo,1995).Bukaveckas et al.(2018)used the mass balance method to quantify nutrient retention in the James River Estuary,a sub-estuary of the multi-branched Chesapeake Bay.The mass balance method was also used to assess inorganic nutrients(N and P)in the Iajai-Açu River Estuary,Brazil(Filho and R¨orig,2016),to evaluate nutrient fluxes in the Swan River in Australia(Robson et al.,2008),to calculate copper,cadmium,and lead fluxes in the Morlaix Estuary in Brittany,France(Monbet,2004a,2004b,2006),to quantify sediment fluxes in the Long Island Sound(Bokuniewicz et al.,1976),and to compute water and salt mass in the Duwamish River Estuary in Washington(Stoner,1972).More recent studies used the mass balance method combined with physically-based hydrodynamic models.However,these models generally require a high degree of system-specific parameter calibrations.Although ecosystem mass balances can be considered as traditional inflow and outflow mass budgeting,they are able to provide rational estimates with minimal tools needed.Despite water quality problems,few studies have been conducted on the Shakujii River.It is more important to understand the shortterm variability of water quality and flow in complex estuarine systems during a rainfall event than to evaluate the general mean conditions alone.
This study aimed at quantifying flow dynamics and spatiotemporal variation in salinity,suspended sediment(SS)concentration,and dissolved oxygen(DO)concentration in urban tidal estuaries during a flood event through the mass balance method.Due to weather and time constraints,one of the monitoring stations had no flow velocity data.The discharge and fluxes of salt,SS concentration,and DO concentration at the station with missing data were estimated with the mass balance method.The advective salt transport components were also calculated to determine the behavior of salt fluxes during a rainfall event.This study did not only include the inflow and outflow budget,but also delineated the seaward and landward flows and fractions of saltwater and fresh water in a flow volume.Salt,sediment,heavy metals,and nutrient accumulation have been severely high in rivers,estuaries,and coastal regions all over the world.This method may be applied to generate good estimates for studies with limited data at hand or for applicability in ungauged stations.The findings of this study can potentially help us in understanding the mechanisms of water quality and flow variations during rainfall in a multi-branched urban tidal estuary and in providing scientific guidelines for addressing the seasonal and periodical occurrence of water problems such as scum,odor,and hypoxia.
2.1.Study area
The Sumida River and Shakujii River are located in Tokyo and flow through the Kanto Plain in Japan.The Kanto Plain comprises 40% of the total area of the Kanto region.These rivers collect discharge from the most inhabited and industrialized metropolitan area in Japan.The climate of Tokyo is subtropical with a warm humid summer and a dry winter.The mean annual rainfall is 1 530 mm.
The Sumida River is located on the west side of Tokyo Bay(Fig.1).It is one of the major rivers in Tokyo.It flows through the deltaic lowland of Central Tokyo with a population of approximately 3 million.It receives fresh water from the Arakawa,Shingashi,Shakujii,and Kanda rivers.All these rivers flow into Tokyo Bay.The length of the Sumida River is 23.5 km.The upstream and downstream edges of the river are located at the Iwabuchi sluice gate and around the lower area of the Tsukiji Market,respectively.The basin includes the Shingashi River and tributaries such as the Kanda and Shakujii rivers with a drainage area of approximately 690 km2.
From the junction with the Sumida River,the Shakujii River flows through the Tokyo metropolitan area with a length of approximately 25.2 km.The confluence of the Shakujii River and the Sumida River is located 16.15 km from Tokyo Bay(Fig.1).The basin belongs to an urban area with land uses of parks,high-rise residences,office buildings,and commercial and small industrial facilities.The total catchment area is 61.6 km2with 154 outfall chambers.
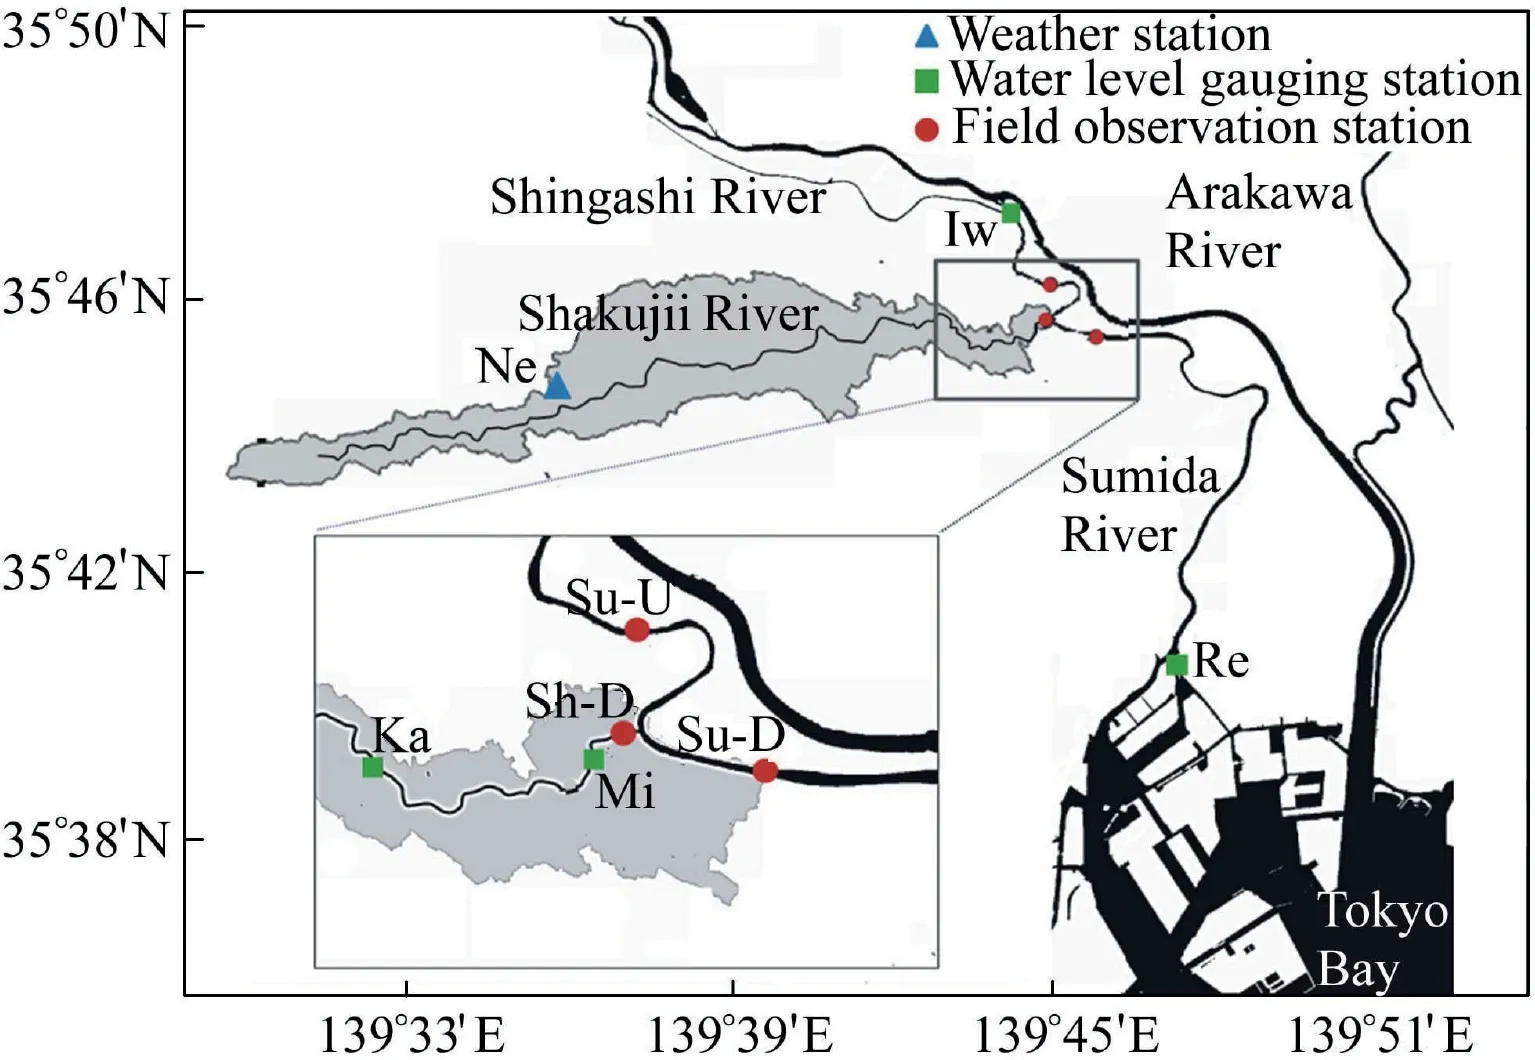
Fig.1.Location of study area and stations(Nerima weather station(Ne),Reiganjima(Re)and Iwabuchi sluice gate(Iw)water level gauging stations on Sumida River,upstream Kagabashi(Ka)and downstream Mizotabashi(Mi)water level gauging stations on Shakujii River,and field observation stations(Sh-D,Su-U,and Su-D)).
The Sumida River Estuary is in an area with relatively flat topography and with varied bottom depths from upstream to downstream channels(Fig.2(a)).In contrast,the Shakujii River Estuary has steep upstream slopes,at a distance from the junction of 1.0-1.4 km,but is relatively flat in the downstream area,in particular near its confluence to the Sumida River(Fig.2(b)).
The study area was located in the tidal area of the Shakujii River and at the stations near the junction of the Shakujii and Sumida rivers(Fig.1).The data were gathered downstream of the Shakujii River(at the Sh-D Station)and upstream and downstream of the Sumida River(at the Su-U and Su-D stations).
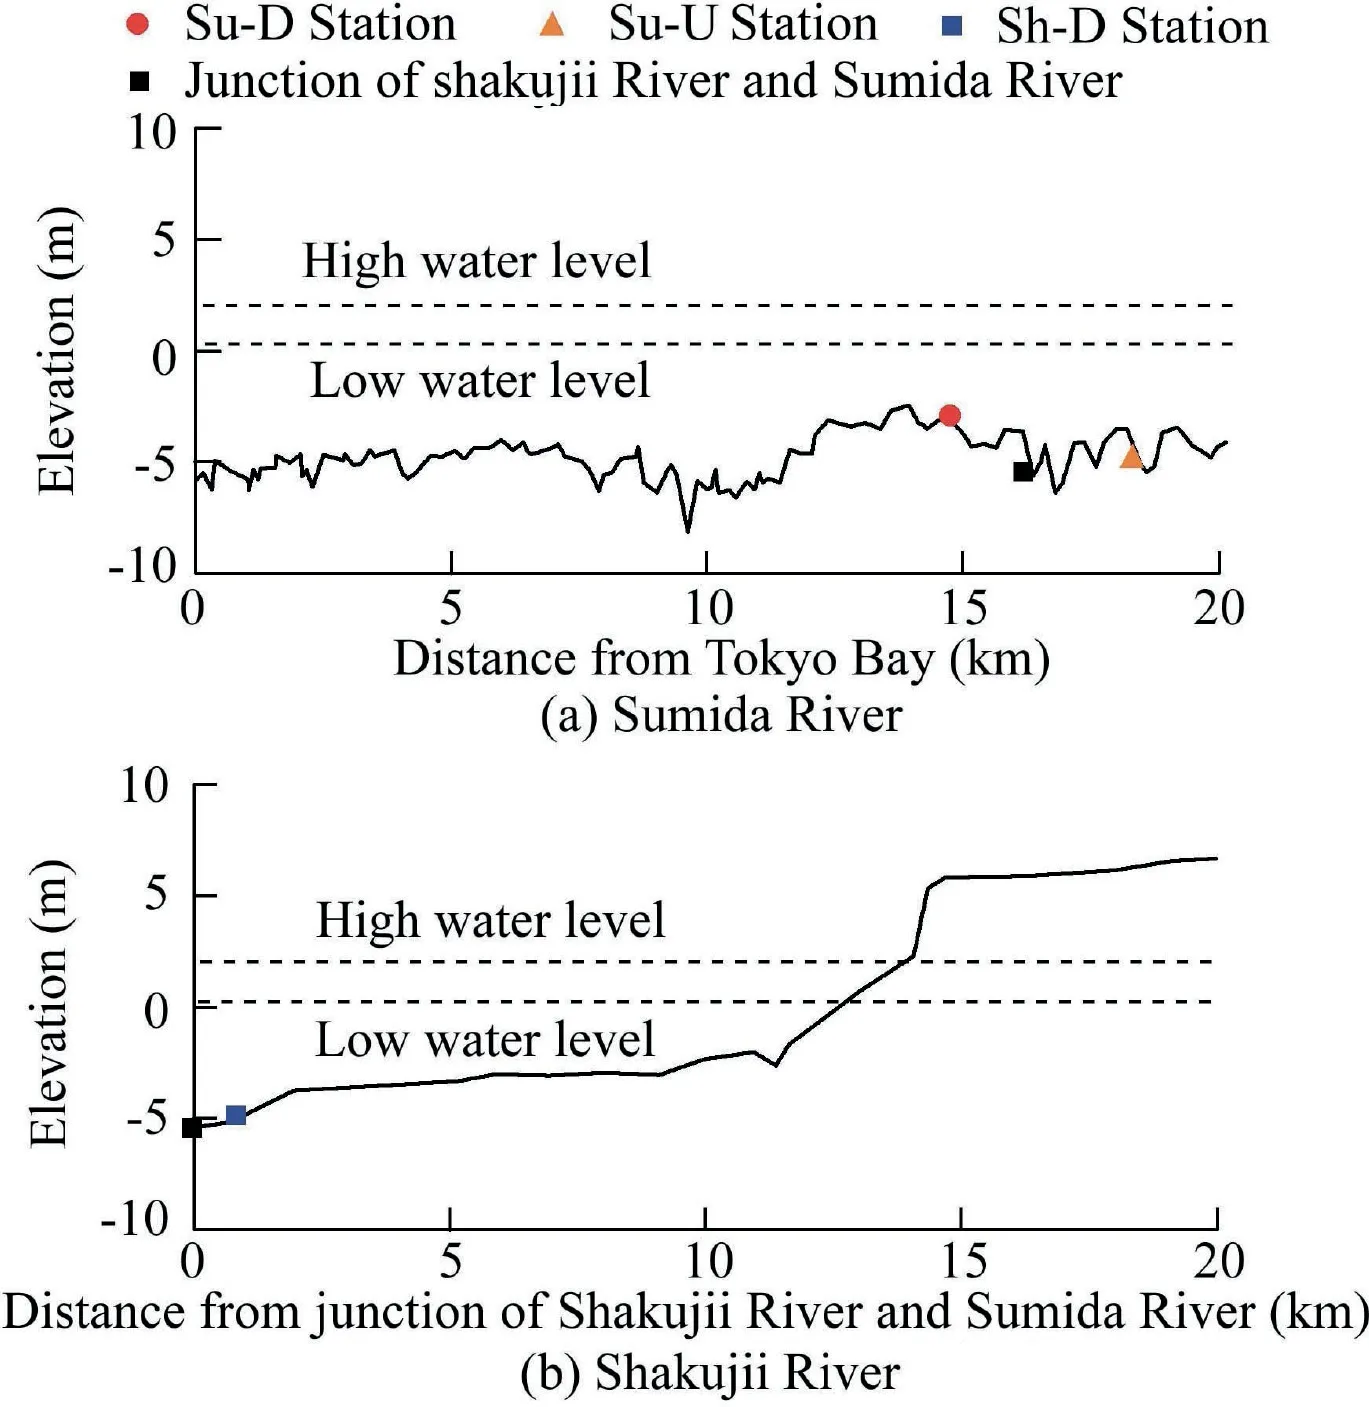
Fig.2.Longitudinal river bed topography with elevation(in Arakawa Peil,m).
2.2.Field measurement and laboratory analysis
The topographic elevations of the Shakujii and Sumida rivers were obtained from the Tokyo Metropolitan Government.The rainfall intensity data was gathered from the website of the Japan Meteorological Agency to determine its effect on the fresh water discharge at the Kagabashi gauging station(Ka Station)in the Upper Shakujii River.
Field observation was performed on November 11,2016 after a heavy rainfall event.The precipitation of this month was in a return period of one year,which was representative of the mean condition.The data were gathered from 9:30 to 22:00 at a 30-min interval.Water quality parameters such as salinity,turbidity,and DO concentration were measured at each station using conductivity,temperature,and depth(CTD)probes with an optical backscatter sensor for turbidity(AAQ,JFE Advantech,Japan).Water quality data were measured at a 0.1-m depth interval at the Sh-D,Su-D,and Su-U stations(Fig.1).Water level was measured at the Sh-D and Su-D stations using a HOBO U20 water level logger with a resolution of 2.1 mm(Onset,USA).An electromagnetic current meter(Infinity-Em,JFE Advantech,Japan)with a data logger and built-in compass was used to measure water velocity at the Sh-D and Su-D stations.The Su-D gauging station is located on a bridge with a width of 99 m.Hence,the station was divided into three sections.A total of four current meters were set up simultaneously,one at the Sh-D Station and three at the Su-D Station.The devices were set up at a 0.5-m depth interval at the Sh-D Station and at a 1.0-m depth interval at the Su-D Station.The Su-U Station had limited data due to weather conditions and time constraints.
Water samples were collected from the Shakujii River and Sumida River.The particulate organic matter(POM)and SS concentrations were determined by the laboratory analysis of water samples.The samples were filtered through a drying oven and pre-weighed glass microfiber filters with a pore size of 0.7μm.The loss on ignition analysis determined the POM concentration from the filtered SS.The SS concentration was analyzed through the filtration and gravimetric methods.A linear regression of the analyzed SS concentration(C(SS))and in-situ turbidity(T)yielded a determination coefficient(R2)of 0.89 through the following relationship:

2.3.Data processing
2.3.1.Analysis of velocity data
The velocity vector considering volume continuity has the following magnitude and direction components:
Field observation was conducted after a heavy rainfall event,with technical and mechanical errors existing in the data.A few data discrepancies were found in data analysis,in which far higher data values were present in comparison with the data values in the normal range.These data were considered errors and were excluded from further analysis.Calibrations were conducted to ensure data uniformity across the three stations.The current meter did not properly measure the velocity profile at the Sh-D Station due to high storm discharge and the presence of water plants and litters.The missing velocity data were computed by the logarithmic law for open channel flow,which is determined as follows:
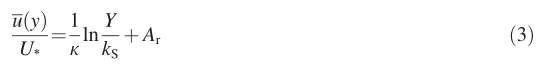
whereYis the distance from the bed(m),U*is the friction velocity,κis the Karman constant(κ=0.41),kSis the equivalent roughness(kS=n/0.041 76,withnbeing Manning"s coefficient),andAris a constant(Ar=8.5).Given thatkSandU*were unknown,calculations were repeated to minimize the error.Values ranging from 0.018 to 0.025 were used for Manning"s coefficient for river channels with muddy beds.
2.3.2.Water balance analysis
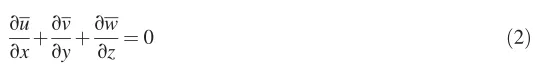
The estuarine characteristics may be predicted by quantifying water circulation and mixing processes(Bowen and Geyer,2003;Dyer,1997).The mass conservation principle was used for water balance computations.With the established river sections as the boundaries for controlled volume,water balance was described by the following mass conservation equations:
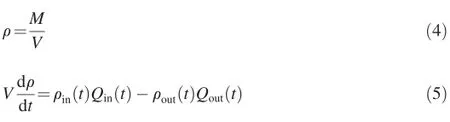
whereρis the density(kg/m3),Mis the mass(kg),Vis the volume(m3),tis time(s),ρinis the inflow density(kg/m3),Qinis the inflow discharge(m3/s),ρoutis the outflow density(kg/m3),andQoutis the outflow discharge(m3/s).
The discharge was computed using the data from the electromagnetic current meter with the following equation:
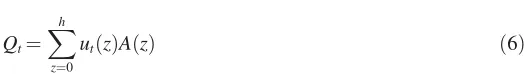
whereQtis the discharge(m3/s)at timet,his the depth(m)with the surface denoted asz=0,utis the longitudinal velocity(m/s)measured at a specific depth at timet,andAis the channel cross-sectional area(m2).The positive and negative velocities were considered,thereby separating the seaward(positive)and landward(negative)flows in water balance computation.
The discharge at the Sh-D and Su-D stations was used to estimate the discharge at the Su-U Station.Continuity was assumed within the study area,where three observation stations were set up.The mass budget was simplified to be volume budget,given by the following equations:
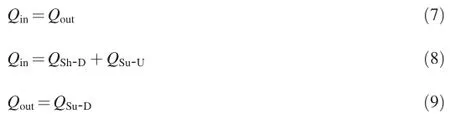
whereQinis the inflow discharge at a particular time(m3/s)over which the water balance was calculated,andQoutis the outflow discharge at the Su-D Station.The total inflow from the Su-U Station(QSu-U)and the Sh-D Station(QSh-D)was summed up to be considered the outflow at the Su-D Station(QSu-D).
2.3.3.Mass balance analysis
The vertical salinity profiles were analyzed,and it was found that stratification abruptly changed at a salinity value of 3.5 at all stations.The fractions of fresh water and saltwater in a particular volume of water were computed by considering this salinity value.The flow with salinity values higher than 3.5 was denoted as saltwater whereas the flow with salinity values below 3.5 was considered fresh water.
The mass balance method was used to investigate the variations of salinity,SS concentration,and DO concentration at the Su-U Station.Salt was treated as a conservative substance with no source and sink in this study.
The dispersal of both dissolved and suspended substances may be understood through the mechanism and variability of salt distribution(Bowen and Geyer,2003;Dyer,1997).Sediment flux in an estuary can be quantified in the same way as salt fluxes(Dyer,1997).Salinity influences oxygen solubility.Therefore,salt transport process may correspond to the DO flux.The mass balance(mass flux)at a particular time was calculated using the following equation:
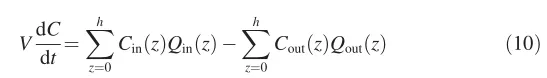
whereCis the concentration(kg/m3)of certain substances such as salt,SS,and DO at a particular depthz,andVdC/dtis the mass flux(kg/s);Cinis the concentration at the Su-U and Sh-D stations;andCoutis the concentration at the Su-D Station.
2.4.Salt transport computation
Many studies have been conducted on advective salt flux analysis in estuaries(Cavalcante et al.,2017;Dyer et al.,1992;Priya et al.,2016;Siegle et al.,2009).In this study,the salt flux per unit width,Ft(kg/(m.s)),was calculated using similar equations as those presented in Casila et al.(2019).
The total salt transport for one or more tidal cycles is related to physical processes such as fluvial advection,Stoke"s drift,tidal diffusion,gravitational circulation,oscillatory shear,tidal dispersion,and residual circulation,which were computed individually(de Miranda et al.,1998;Priya et al.,2016;Siegle et al.,2009).The effect of each term on salt transport was analyzed,and the net advective salt transport at the Sh-D and Su-D stations was computed.
3.1.Hydrologic conditions
A total rainfall depth of 43.5 mm was recorded on November 11,2016(Fig.3(a)).This was the highest rainfall depth in November 2016.The highest daily rainfall depth in 2016 was 145.5 mm.On the day of observation,98.85%of the rainfall was recorded from 0:00 to 8:00 prior to field measurement.Rainfall values were analyzed using the Hydrologic Engineering Center-Statistical Software Package(HEC-SSP)to determine the return period.It was found that the annual maximum rainfall and the maximum rainfall in November from 1976 to 2017 were well fit by the Log-Pearson Type III distribution.The annual maximum daily rainfall analysis showed a return period of one year.Meanwhile,the analysis of the maximum daily rainfall in November showed a return period of 2.85 years.
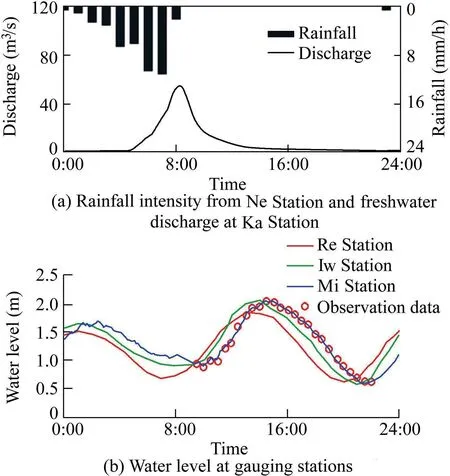
Fig.3.Time series of precipitation,discharge,and water level on November 11,2016.
The Shakujii River was influenced by both river discharge(fresh water discharge at the Ka Station,Fig.3(a))and tidal flow(mixed semi-diurnal tide at the Mi Station,Fig.3(b)).The Re Station had the earliest flood tide since it is located in the downstream area with the closest proximity to Tokyo Bay(Fig.1).
3.2.Temporal variation
Fig.4 shows the temporal variation of the vertical profile of velocity.At the Sh-D Station during flood tide,strong water currents(0.28-0.43 m/s)moving seaward were evident at 9:30 after rainfall(Fig.4(a)).The seaward-moving currents continued to flow at the Sh-D Station at the subsurface during the ebb tide.Landward-moving currents were present at the bottom of the Sh-D Station from 10:30 during the flood tide(-0.03 m/s)to the ebb tide(approximately-0.1 m/s).The Su-D Station also had vertically uniform velocities(0 to-0.3 m/s)moving landward during the flood tide from 12:00 to 14:00(Fig.4(b)).These flow dynamics indicated that the strong saline water current flowing landward from the wedge was entrained by fresh water in the upper layer.The Su-D Station had a high landward-moving current because of the large effect of tidal amplitude.This condition is common in downstream areas near the saline water source.
A maximum surface flow of 0.66 m/s moving seaward was measured during the ebb tide at the Su-D Station.The ebb tidal currents were higher than the flood tidal currents because the flood discharge generated from rainfall enhanced the riverine flow.
For the whole tidal cycle at the Sh-D Station,the surface and bottom salinity values varied across the ranges of 0.1-0.9 and 0.1-7.1,respectively(Fig.5(a)).Stratification was caused by high riverine discharge and dense saltwater intrusion at the bottom depth.Saltwater intrusion started at 11:00 at the Sh-D Station,but saltwater was retained in the Shakujii River until low tide.This was caused by the very low amount of change in channel slope(Fig.2(b)).
The Sumida River stations had stratified to partially mixed water columns(Fig.5).The surface and bottom salinity values at the Su-U Station changed over ranges of 0.7-1.9 and 0.75-11.4,respectively(Fig.5(b)).The Su-D Station had surface and bottom salinity ranges of 1.7-4.7 and 1.8-9.5,respectively(Fig.5(c)).Since saltwater intrusion is dominated by gravity,the bottom elevation of-3.00 m was used for salinity comparison to unify the lowest elevation across all stations.At this elevation,the salinity level at the Su-D Station was higher than those at the other two stations throughout the tidal cycle.This is because the Su-D Station is the nearest station to Tokyo Bay.The bed slope is inversely graded from the Su-D Station to the upstream area.The bed elevation is-4.88 m at the Su-U Station and-3.58 m at the Su-D Station(Fig.2).The Su-U station had a higher salinity(with a maximum of 11.4)at the bottom than Su-D(with a maximum of 9.5),owing to the lower bed elevation that caused saltwater retention.This reduced the ratio of river flow to tidal flow and thus decreased vertical tidal mixing.
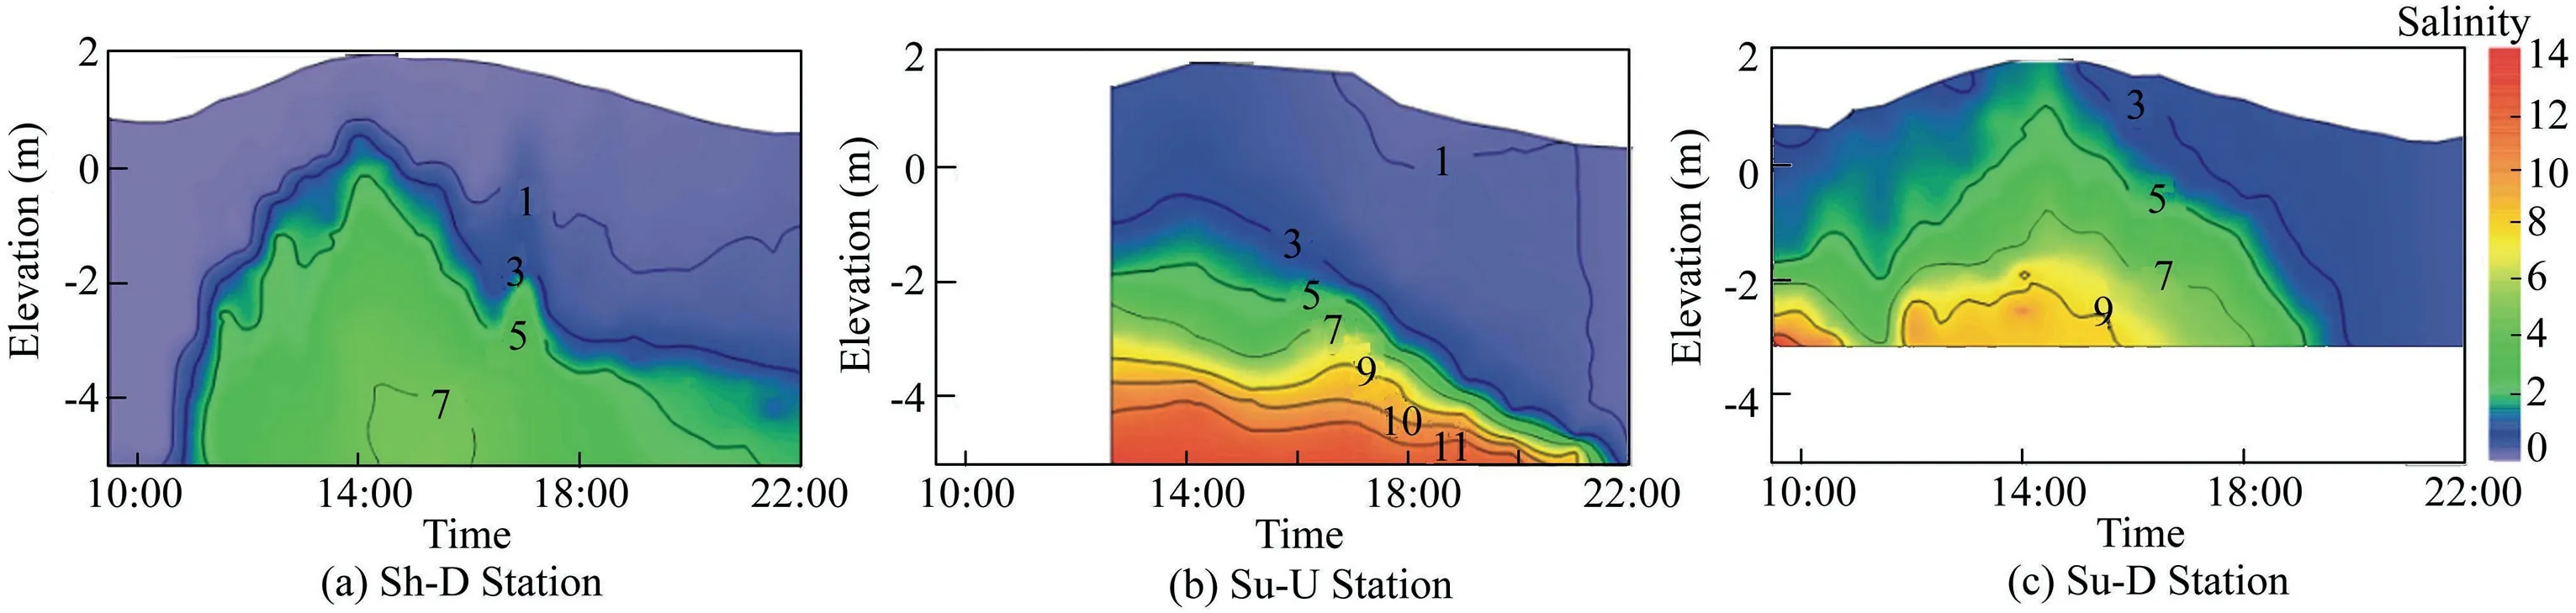
Fig.5.Temporal and vertical profiles of salinity at different stations on November 11,2016.
At the beginning of the flood tide at 9:30,the SS concentration of water column(70-80 mg/L)at the Sh-D Station corresponded to the river flow moving seaward(Fig.6(a)).Fresh water carried a large amount of SS,which was advected from the upper to lower Shakujii River.During the transition from flood tide to high tide(from 9:30 to 14:00),a relatively low SS concentration(<20 mg/L)was observed in the Sumida River(Fig.6(b)and(c)).During the ebb tide,the Sh-D Station showed a consistent decreasing trend in SS concentration,whereas the SS concentration of the water column in the Sumida River increased to above 30 mg/L at 20:00.The high SS concentration(60-88 mg/L)at the bottom depth of the Su-D Station in the period of 19:30-22:00 may have been caused by bottom sediment erosion or the settling of flocculated sediment.This result is significant because SS at the Su-D Station may be transported to the Sh-D Station and the Su-U Station when tide rises again.
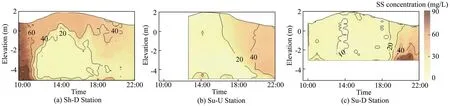
Fig.6.Temporal and vertical profiles of SS concentration at different stations on November 11,2016.
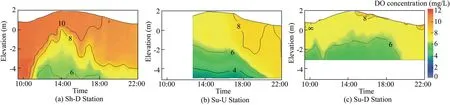
Fig.7.Temporal and vertical profiles of DO concentration at different stations on November 11,2016.
Fig.7 shows the DO concentration of the water column for one tidal cycle at different stations.Throughout the tidal cycle,the surface and bottom DO concentrations at the Sh-D Station varied between 9.28 and 10.96 mg/L and between 5.69 and 11.18 mg/L,respectively.During the onset of the flood tide,saltwater intrusion at the Sh-D Station was blocked by strong river flow after heavy rain.A landward-moving saltwater intrusion event started at 11:00 when river flow became weak.This was characterized by a decrease(below 10 mg/L)in the bottom DO concentration(Fig.7(a)).Saltwater reversed its flow to the seaward direction during the ebb tide.Thus,low DO concentration was retained at the bottom until low tide.At the Su-U Station,the surface and bottom DO concentrations ranged from 6.6 to 8.7 mg/L and from 3.4 to 7.8 mg/L,respectively,throughout the tidal cycle.At the Su-D Station,the surface and bottom DO concentrations ranged from 6.8 to 10.2 mg/L and from 3.9 to 7.5 mg/L,respectively.The minimum DO concentration at the bottom of the Su-U Station(3.4 mg/L)was lower than that of the Su-D Station(3.9 mg/L),which corresponds with the salinity retention found at the Su-U Station.The Su-D Station was highly affected by the fresh water from the Shakujii River and from upstream tributaries,leading to a brackish water condition.
3.3.Water balance analysis
Fig.8 illustrates the flood and ebb flow oscillations.The highest discharge(39.8 m3/s)at the Sh-D Station appeared after rainfall,and the lowest discharge(1.8 m3/s)occurred during the low tide(Fig.8(a)).These showed the effect of flood discharge and river flow recession during the ebb tide.Landward flow in the Sumida River during flood tide(from 9:30 to 13:00)was observed because of saltwater intrusion(Fig.8(b)and(c)).However,the high fresh water discharge after rainfall was transported to the Su-D Station,causing a reverse inflow direction.The seaward positive flow demonstrates the effect of fresh water influx.The highest discharge at the Sh-D Station(Fig.8(a))was approximately 4.5 times lower than the highest discharge(183.7 m3/s at the Su-D Station and 177.6 m3/s at the Su-U Station)at the Sumida River stations(Fig.8(b)and(c)).This was because the channel cross-section at the Sh-D Station was smaller than those of the Sumida River channels(Fig.9).The flow in the Shakujii River was highly influenced by upstream fresh water,whereas the Sumida River has the Arakawa,Shingashi,and Shakujii rivers as the upstream tributaries.
The lowest discharge at the Su-U Station(2.7 m3/s seaward and-3.5 m3/s landward)and Su-D Station(8.3 m3/s seaward and-11.9 m3/s landward)appeared in the slack water period at 14:00(Fig.8(b)and(c)).Slack water period occurs before tide direction reverses(Bowditch,2002).
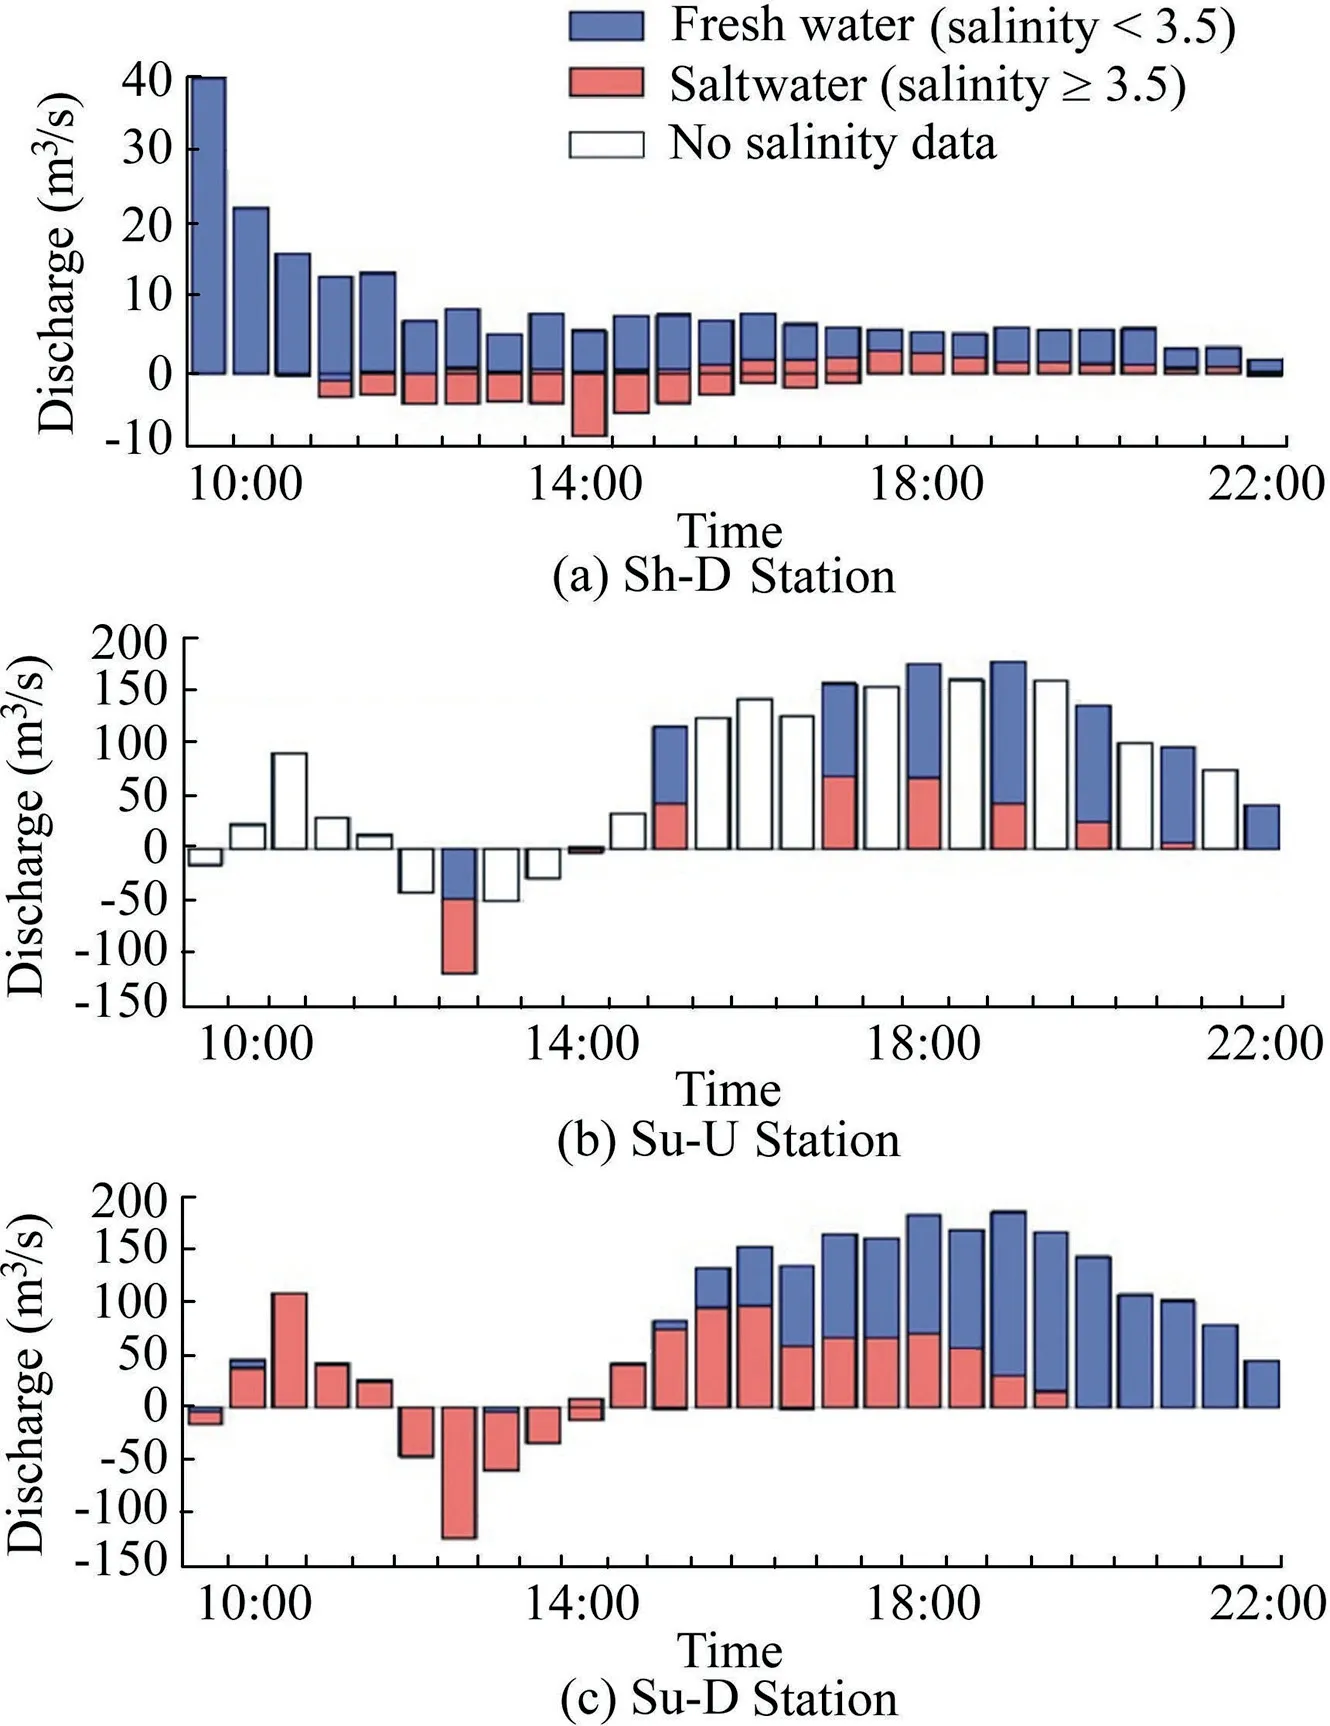
Fig.8.Fresh water and saltwater discharge at Sh-D,Su-U,and Su-D stations on November 11,2016.
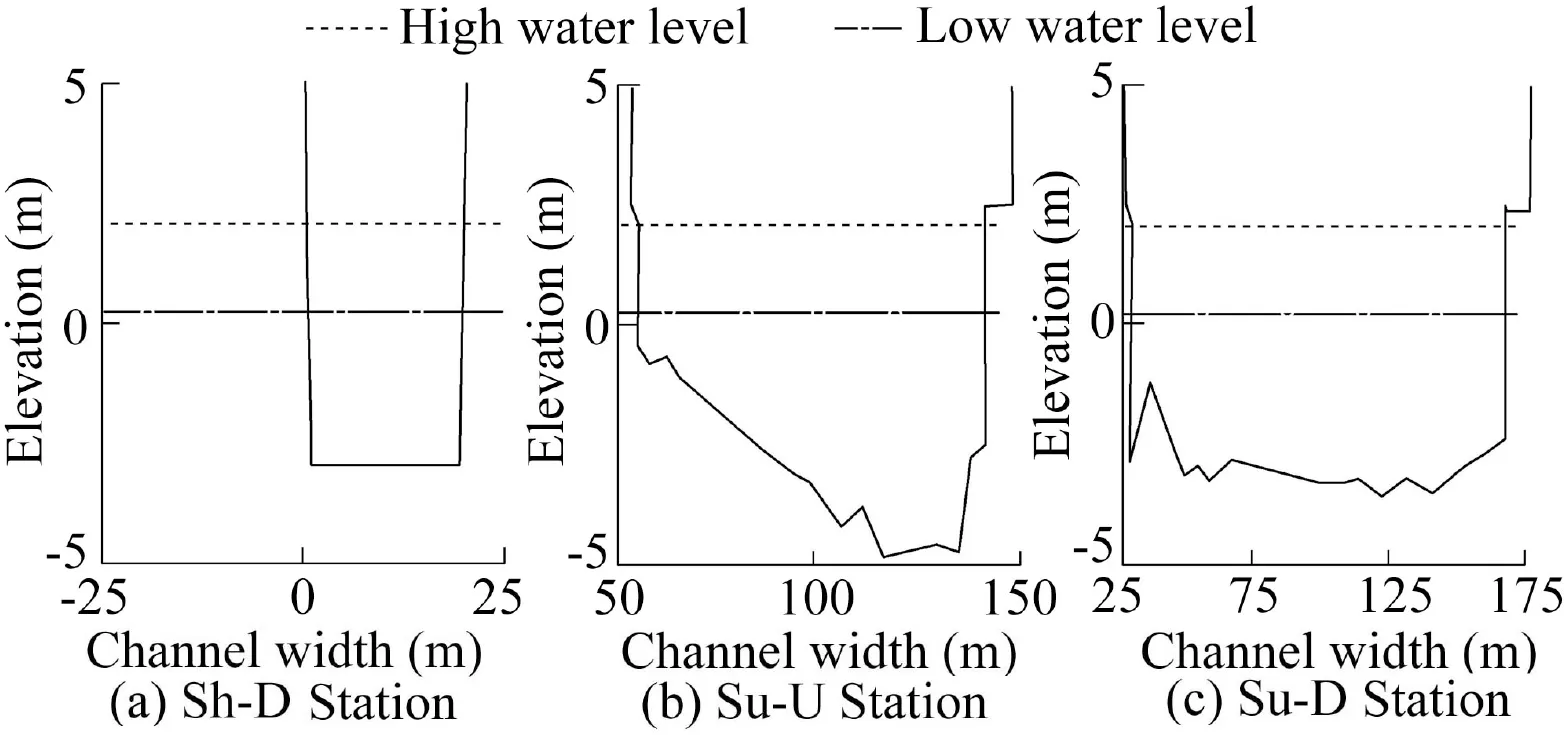
Fig.9.Channel cross-sectional topography at Sh-D,Su-U,and Su-D stations.
3.4.Mass balance
3.4.1.Salt,SS,and DO fluxes
Figs.10 through 12 show the seaward flow,landward flow,and fractions of fresh water and saltwater with the mass fluxes.The fluxes at the Su-U Station were estimated with the mass conservation principle.
Salt flux in the upstream direction during the high flood tide was evident in the two rivers,even with the incoming seaward fresh water after rainfall(Fig.10).The highest salt fluxes appeared at 14:00 at the Sh-D Station(53.8 kg/s)and at 12:30 at theSu-UStation(680.3kg/s)andattheSu-DStation(703.7kg/s).The salt flux in the Shakujii River was approximately 20 times less than that in the Sumida River(Fig.10(a))because of the large differences in channel size(Fig.9)and the presence of tributaries(Fig.1).The source of saltwater in the Shakujii River is the Sumida River,and the Sumida River directly receives saltwater from Tokyo Bay.The saltwater was subsequently diluted by the incoming fresh water during the ebb tide.In the Shakujii River,the effect of saltwater was still evident during the ebb tide due to the channel topography(Fig.2(b)).

Fig.10.Salt fluxes at Sh-D,Su-U,and Su-D stations on November 11,2016.

Fig.11.SS fluxes at Sh-D,Su-U,and Su-D stations on November 11,2016.
The highest SS flux of 3.1 kg/s was observed at the Sh-D Station at 9:30 after rainfall(Fig.11(a)).SS in the fresh water was advected from upstream to downstream of the Shakujii River.SS transport was also evident in the Sumida River.The SS flux was low during the flood tide and increased during the ebb tide.The SS flux(Fig.11(b)and(c))peaked at 20:00 at the Su-U Station(6.1 kg/s)and at the Su-D Station(6.3 kg/s).This indicates that upstream fresh water flow carried high amounts of SS during the ebb tide.These materials were transported from upstream to downstream in the Sumida and Shakujii rivers.
The DO flux had almost the same trend as the SS flux.The highest DO flux at the Sh-D Station was 0.4 kg/s at 9:30 after rainfall.The Shakujii River carried oxygenated fresh water throughout the tidal cycle(Fig.12(a)).Meanwhile,the DO flux(Fig.12(b)and(c))peaked at the 19:00 at the Su-U(1.15 kg/s)and Su-D stations(1.20 kg/s).A simple dilution without oxygen consumption in the water(Fig.13)demonstrates the relationship between salinity and DO.The assumption for the DO concentration was 8 mg/L for fresh water and 0 mg/L for saltwater.After rainfall,the Shakujii River was sufficiently mixed with DO at a level of approximately 11 mg/L that was supplied by rapid storm runoff.DO in the Sumida River can be explained by the dilution between the hypoxic seawater in Tokyo Bay and the fresh water with high DO from the upstream regions.The topography of riverbed affected DO in the Sumida River.The channel at the Su-U Station is deeper than that at the Su-D Station.Therefore,DO may be consumed and decrease to 8 mg/L.
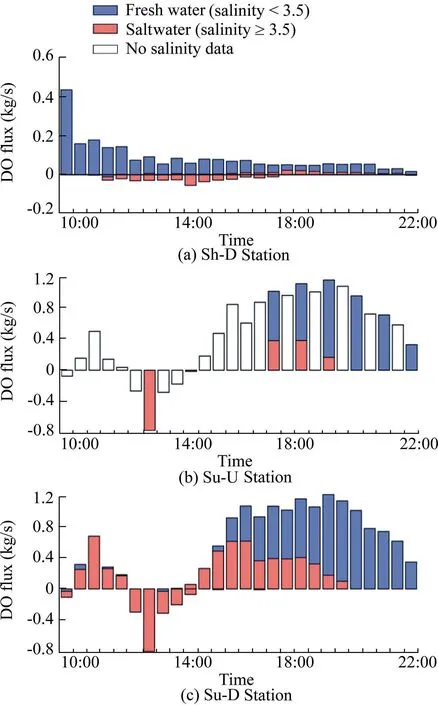
Fig.12.DO fluxes at Sh-D,Su-U,and Su-D stations on November 11,2016.
3.4.2.Linear regression analysis
The mass fluxes at the Sh-D and Su-D stations were computed by summing the product of concentration(measured at a depth interval of 0.1 m),channel width,depth,and velocity.The computed concentration at the Su-U Station(Eq.(10))was estimated by dividing the flux difference of the Sh-D and Su-D stations by the discharge of the Su-U Station that was derived through the water balance.The measured concentrations were the mean values of salinity,SS concentration,and DO concentration from the surface to the bottom at a 0.1-m depth interval.Both the computed and measured values were the vertically averaged concentration.
A slope of 0.813 5 in the regression equation was obtained(Fig.14(a))between the computed salinity ranging from 1.7 to 9.2 and the measured salinity ranging from 0.7 to 5.8.This indicates that the measured salinity was lower than the computed values.However,when the regression analysis was carried out without including the highest computed salinity,the slope became 0.973 4(indicated as the black dashed line in Fig.14(a)).The slope increased after removal of the outlier,indicating that salinity was conserved in the study area except for one measured data point.During the slack water period,the outlier salinity value appeared in the Sumida River at 14:00 in high tide.The average vertical velocities in the left and right channel regions and the channel center were-0.033 6,0.006 8,and 0.004 8 m/s,respectively.The differences of velocities at the cross-section may lead to horizontal eddies.Therefore,the variation between the estimated and measured salinity may be attributed to the non-uniformity of the vertical velocity and salinity profiles in the Sumida River and Shakujii River(Figs.4 and 5).As shown in Fig.9(b)and(c),the elevation of the Su-U Station is lower than that of the Su-D Station.This may further cause higher computed average salinity driven by salt retention.
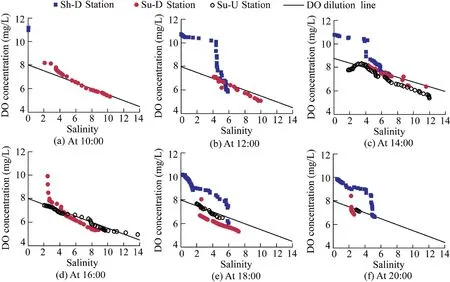
Fig.13.Relationship between salinity and DO concentration on November 11,2016.

Fig.14.Linear regression of computed and measured data at Su-U Station.
The high slope of regression equation in Fig.14(b)shows that SS was conserved.Sediment was transported from upstream to downstream,instead of settling down in the channel between the Su-U and Su-D stations.The values of the computed and measured SS concentrations may vary owing to the differences in the SS characteristics,fluxes in these two estuaries,and the occurrence of turbulence and bottom sediment erosion at the Su-D Station(Fig.6(c)).The presence of many CSOs and high amounts of POM may also significantly affect sediment flocculation,in particular,in the Shakujii River(Casila et al.,2017).A linear relationship between SS concentration and POM was found at the Sh-D Station,and the ratio of POM was approximately 50%of the SS concentration.This indicates that SS brought by land drainage and flow from rainfall contains a large amount of organic matter.Given that organic matter has a bonding effect on mineral particles,a high ratio of organic matter with low salinity accelerates flocculation.This may explain the increasing trend of the SS concentration from lower than 20 mg/L to 30 mg/L at the Sh-D Station during the ebb tide(Fig.6(a)).Flocculation may also explain the increase of the SS concentration at the bottom of the Su-D Station from 19:30 to 22:00 during the ebb tide(Fig.6(c)).The suspended particles at the Su-D Station may have organic matter produced by phytoplankton,which are originally in the Sumida River or transported from Tokyo Bay.
The computed and measured DO concentrations may have a strong correlation because of a few factors.The DO level in the Shakujii River was always high due to fresh water from the upstream source,whereas that in the Sumida River was highly influenced by the unoxygenated nature of the saline water from Tokyo Bay.The non-uniformity of the vertical velocity and salinity profiles also demonstrates the dissimilarity of the DO profile.During the flood tide after rainfall,flow in the Sumida River moved seaward.Subsequently the entire flow reversed to the landward direction owing to saltwater intrusion.After the slack water period,flow direction changed again in the Sumida River when the ebb tide appeared.This was different from the situation in the Shakujii River.Flow in the Shakujii River moved seaward throughout the tidal cycle.Its subsurface flow moved landward during the flood tide,and the minimal landward flow occurred at the river bottom until the ebb tide appeared.The lower riverbed elevation at the Su-U Station may also cause the lowest computed average DO concentration(4.5 mg/L)at 14:00 in high tide due to saltwater retention(Fig.13(c)).High fresh water flux from the tributaries of the Sumida River was diluted by saltwater.Mixing caused by the differences in water density and DO level in the Shakujii and Sumida rivers may lead to the difference between the computed and measured DO concentrations.
According to the Pearson"s correlation analysis,theRvalues of 0.950 for salinity and 0.835 for SS concentration had a strong significant correlation with apvalue lower than 0.01.A moderate correlation(R=0.638)was obtained for DO.Therefore,the mass balance method should be feasible for estimating salinity and SS concentration,even in high flood discharge conditions,but may not be accurate enough for DO.This method can be reliable when data are missing,and it is useful for understanding the dynamics of fresh water and saltwater within a complex system of multi-branched urban tidal estuaries.
3.5.Salt transport decomposition
Table 1 demonstrates the results of the advective salt transport.The positive and negative values denote the downstream and upstream salt transport,respectively.In the Shakujii River and Sumida River,the predominant factor controlling downstream salt transport after rainfall was the fluvial or riverine discharge.This is the same as in other estuaries where fresh water flow dominates salt transport(Cavalcante et al.,2013;de Miranda et al.,1998;Priya et al.,2016;Siegle et al.,2009).The difference in riverine discharge was caused by the tributaries of the Sumida River.
The second predominant factor and the largest contributor to upstream salt transport in both rivers was tidal diffusion.This is attributed to the longer periods of upstream currents,in particular in the Shakujii River,where upstream velocity(Fig.4(a))and salinity retention(Fig.10(a))were found even until the ebb tide.The Sumida River also had a high value of tidal diffusion owing to its proximity to Tokyo Bay.
Stoke"s drift was the third-most and fourth-most dominant factor in the Sumida River and Shakujii River,respectively.This component controlled upstream salt transport in both rivers.Stoke"s drift explains the phenomenon when flood currents are higher than ebb tidal currents.The lower Stoke"sdrift value in the Shakujii River is explained by the short flood period with a relatively higher current velocity than that in the ebb tide.The values were low owing to the more pronounced effect of tidal diffusion.
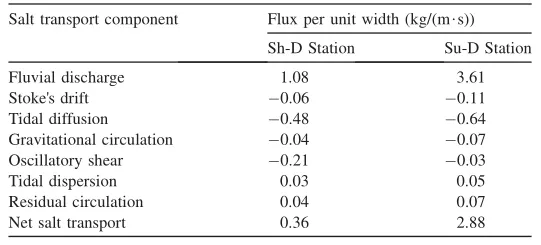
Table 1 Advective salt transport components in Shakujii River(Sh-D Station)and Sumida River(Su-D Station).
The next-most important term in the Sumida River was gravitational circulation.The presence of fresh water increased the thickness of the denser saline water,and this explains the effect of gravitational circulation.Gravitational circulation led to the increase of the upstream baroclinic pressure gradient with a strong vertical gradient of salinity.The high river discharge from storm runoff lowered surface salinity and presumably increased the intensity of the gravitational circulation.
Oscillatory shear was the third-most dominant term in the Shakujii River and played similar roles in both rivers.Its effect was that salt flux at the Sh-D and Su-D stations tended to move upstream.Oscillatory shear at the Sh-D Station was higher than that at the Su-D Station,indicating that higher residuals were produced by turbulence and small-scale physical processes.The low value of oscillatory shear at the Su-D Station is explained by the local significance of this component to the overall salt balance,which often appears in partially mixed estuaries(Dyer,1997).
Residual circulation considers the time-varying,depthaveraged salinity and depth oscillation multiplied with the time-averaged mean velocity.Meanwhile,tidal dispersion covers the time-averaged velocity,salinity,and depth.Both components caused downstream advection of salt fluxes in both rivers.The upstream salt fluxes were counteracted by the downstream salt fluxes.The results showed a net downstream salt movement,indicating the effect of flood discharge on salt transport mechanisms.
The net salt fluxes per unit width at the Sh-D and Su-D stations were 0.36 and 2.88 kg/(m.s),respectively.This large difference may result in low salt flushing in the estuary.This result conforms with the salt retention detected in the salinity profile(Fig.5(a))and the presence of salt flux until the ebb tide(Fig.10(a))at the Sh-D Station.The high riverine discharge was counteracted by the strong upstream saltwater intrusion.A low salt flux of 0.007 kg/(m.s)during the neap tide was also found at the Sh-D station(Casila et al.,2019).This suggests the probability of salt accumulation in the Shakujii River,in particular,on non-rainfall days.
Intensive field observation was conducted on the Shakujii River and Sumida River.Data measurement was performed for 12.5 h from 9:30(flood tide)to 22:00(ebb tide)after a heavy rainfall event.The mass balance method was used to estimate the discharge and fluxes of salt,SS,and DO at the Su-U Station.The calculated discharge time series demonstrated flow oscillations during flood and ebb tides.High discharge,salt,SS,and DO fluxes were found at the stations on the Sumida River.This is because the channel cross-section at the Sh-D Station was smaller,and the Sumida River has many upstream tributaries such as the Arakawa,Shingashi,and Shakujii rivers.
Regression and correlation analysis were performed with the mass balance-based computed salinity,SS concentration,and DO concentration versus the on-site measured data at the Su-U Station.The mass balance-based salt and SS estimates were in a significant correlation with the observations,whereas a moderate correlation was found in DO.This difference may arise from the non-uniformity of velocity and salinity profiles,topography,sedimentation,and the presence of organic matter and turbulence in channels.At the distances of 3.6 km(from the Su-U Station to the Su-D Station)and 1.54 km(from the Sh-D Station to the Su-D Station),salt and SS accumulated.However,the DO estimates via the mass balance method were not that accurate.Many aerobic reactions might consume oxygen at the three stations.
In the Sumida River and Shakujii River,the major factor governing downstream salt flux advection during the flood event was fluvial advection,followed by residual circulation and tidal dispersion.Stoke"s drift,tidal diffusion,gravitational circulation,and oscillatory shear govern the upstream salt flux advection in both rivers.The high net downstream advective salt flux in the Sumida River reveals less salt accumulation.In the Shakujii River,the low net downstream advective salt flux indicates less salt flushing that leads to salt retention and accumulation.This result conforms with the finding of the mass balance-based computations,which identified salt fluxes at the Sh-D Station until the ebb tide.The findings have the potential to provide an insight into the mechanisms of fresh water-saltwater mixing processes,water quality,and flow variations in a multi-branched urban tidal estuary during a flood event.
Acknowledgements
The authors would like to express their gratitude to the Tokyo Metropolitan Government for providing the extensive data.
Declaration of competing interest
The authors declare no conflicts of interest.